The Bell Curve: Intelligence and Class Structure in American Life (38 page)
Read The Bell Curve: Intelligence and Class Structure in American Life Online
Authors: Richard J. Herrnstein,Charles A. Murray
Tags: #History, #Science, #General, #Psychology, #Sociology, #Genetics & Genomics, #Life Sciences, #Social Science, #Educational Psychology, #Intelligence Levels - United States, #Nature and Nurture, #United States, #Education, #Political Science, #Intelligence Levels - Social Aspects - United States, #Intellect, #Intelligence Levels

But resilience has its limits. Children coming from the least nurturing, most punishing environments are indeed at risk. We will therefore focus throughout this section on children who are in the bottom 10 percent on various measures of their homes.
62
| Which White Children Grow Up in the Worst Homes? | |
|---|---|
| Cognitive Class of the Mother | Percentage of Children Growing Up in Homes in the Bottom Decile of the HOME Index |
| I Very bright | 0 |
| II Bright | 2 |
| III Normal | 6 |
| IV Dull | 11 |
| V Very dull | 24 |
| All whites | 6 |
In the case of the HOME index, the percentages of white children of mothers in the different cognitive classes who are growing up in homes that scored at the bottom are displayed in the table above. It was extremely rare for children of women in the top cognitive classes to grow up in these “worst homes” and quite uncommon for children of women throughout the top three-fourths of the IQ distribution. Only in the bottom cognitive classes did the proportion of such children grow, and then the proportions rose rapidly. Nearly one out of four of the children of the dullest mothers was growing up in a home that also ranked in the bottom decile on the HOME index.
63
The usual assumption about maternal behavior is that a woman’s socioeconomic status is crucial—that she passes on to her children the benefits or disadvantages of her own family background. The figure below summarizes the standard analysis comparing SES and IQ.
A white mother’s IQ is more important than her socioeconomic background in predicting the worst home environments
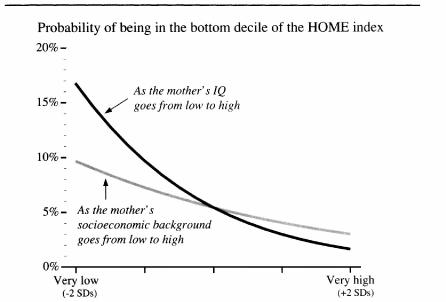
Note: For computing the plot, age and either SES (for the black curve) or IQ (for the gray curve) were set at their mean values. Additional independent variables were used to control for the test year and the age of the children.
Both factors play a significant role, but once again it is worse (at least for the white NLSY population) to have a mother with a low IQ than one from a low socioeconomic background. Given just an average IQ for the mother, even a mother at the 2d centile on socioeconomic background had less than a 10 percent chance of providing one of the “worst homes” for her children. But even with average socioeconomic background, a mother at the 2d centile of intelligence had almost a 17 percent chance of providing one of these “worst homes.”
Many of the problems experienced by poor children are usually attributed in both public dialogue and academic writings to poverty itself.
64
The reasons for this widely assumed link between poverty and developmental problems are harder to spell out than you might think. To repeat a point that must always be kept in mind when thinking about poverty: Most of the world’s children throughout history have grown up poor, with “poverty” meaning material deprivation far more severe than the meaning of “below the poverty line” in today’s America. Many of the disadvantages today’s children experience are not the poverty itself but the contemporary correlates of poverty: being without a father, for example, or living in high-crime neighborhoods. Today, high proportions of poor children experience these correlates; fifty years ago, comparatively few poor children did.
But there are reasons to think that the HOME index might be influenced by poverty. Reading to children is a good thing to do, for example, and raises the HOME score, but children’s books are expensive. It is easier to have books in the house if you can afford to buy them than if you have to trek to the library—perhaps quite far from home—to get them. Similar comments apply to many of the indicators on the HOME index that do not require wealth but could be affected by very low income. We therefore explored how the HOME index was related to the mother’s poverty or welfare recipiency in the calendar year before the HOME score was obtained.
65
Poverty proved to be important, with “being in a state of poverty” raising the odds of being in the worst decile of the HOME index from 4 percent to 11 percent, given a mother of average IQ and socioeconomic status.
66
But adding poverty to the equation did not diminish the independent role of cognitive ability. For example, if the mother
had very low IQ (the 2d centile)
and
was in poverty, the odds of being in the worst decile on the HOME index jumped from 11 percent to 26 percent. Generally, adding poverty to the analysis replaced the impact of the mother’s socioeconomic background, not of her intelligence.
Then we turn to welfare. The hypothesis is that going on welfare signifies personality characteristics other than IQ that are likely to make the home environment deficient—irresponsibility, immaturity, or lack of initiative, for example. Therefore, the worst homes on the HOME index will also tend to be welfare homes. This hypothesis too is borne out by the data: Welfare recipiency was a slightly more powerful predictor of being in a “worse home” than poverty—but it had as little effect on the independent role of IQ.
In trying to decide among competing explanations, the simplest thing to do is to enter both poverty and welfare in the analysis and see which wins out. We summarize the outcome by first considering a child whose mother is of average intelligence and socioeconomic background. If his mother is either poor or on welfare (but not both), the odds of having a terrible home environment (bottom decile on the HOME index) are 8 or 9 percent. If the mother has an IQ of 70, the odds shoot up to 18 to 21 percent. If the mother has very low intelligence, is poor, and is also on welfare, the odds rise further, to 34 percent. A table with some of the basic permutations is given in the note.
67
Still, many of the causal issues remain unresolved. The task for scholars is to specify what it is about poverty that leads to the outcomes associated with it. With the data at hand, we cannot go much further in distinguishing between the effects of lack of money and the effects of other things that “being in poverty” signifies. In particular, the way that poverty and welfare interact in producing a poor home environment provides many hints that need to be followed up.
What can be said unequivocally is that low income as such does not prevent children from being raised in a stimulating, nurturing environment. Such is the story of the regression coefficients, and a conclusion that accords with child rearing throughout history. By the same token, it does not take a genius to provide a child with a stimulating, nurturing environment. The average differences in environment across the cognitive classes are large and in many ways troubling, but, in percentage terms, they explain little of the variance. Abundant examples of excellent parents may be found through all but the very lowest range of cognitive ability.
We conclude, as usual, by considering the role of education through the high school graduate and college graduate subsamples. Holding maternal age and the mother’s socioeconomic background constant at their means, college graduates tend to do well, no matter what their cognitive ability (within their restricted range), even though cognitive ability retains a statistically significant relationship. Within the high school sample, the effects of cognitive ability are plain; the odds of being in the bottom decile on the HOME index for the child of a mother of average socioeconomic background drop from 15 percent for a high school graduate at the 2d IQ centile to 5 percent for a comparable person at the 98th IQ centile. As in the earlier analyses, the most important impact of cognitive ability within the high school graduates seems to be at the low end. Socioeconomic background also continues to play an important independent role, but less than IQ.
Some More Complications
The HOME inventory has two components—a Cognitive Stimulation score and an Emotional Support score—both adapted to three separate age groups (under 3, 3 to 5, and over 5 years of age). We conducted a variety of analyses to explore the subtests’ roles for different age groups. Briefly, the mother’s IQ had the dominant role in determining the Emotional Support score for children through the age of 5, whereas its role in determining Cognitive Stimulation was roughly coequal with education and socioeconomic background—the opposite of what one might predict. Maternal IQ was especially important for Emotional Support to the 3- to 5-year-old group. It would be worthwhile for investigators to explore with other data the NLSY’s indications that parental IQ is especially important for the home environment from ages 3 to 5, and the peculiar finding that parental IQ is more important for Emotional Support than for Cognitive Stimulation.
The NLSY also administered batteries of tests regarding the developmental outcomes for the children of NLSY mothers. We review several indicators briefly, then present a summary index showing the interrelationships the mother’s cognitive ability, socioeconomic background, poverty, and welfare.
The first of the measures applies to very young children (12 to 23 months), and consists of indexes of “difficulty” and “friendliness.” Once again we focus on children who exhibit the most conspicuous signs of having problems—those in the bottom decile—as shown in the following table.
68
Generally, babies were more “difficult”—more irritable, more fearful, and less sociable—for mothers with lower cognitive ability, and they were also less friendly, as measured by this index.
| Which White Toddlers Have the Worst Temperaments? | ||
|---|---|---|
| Percentage of Children in the Most Difficult Decile on the Difficulty Index | Cognitive Class of the Mother | Percentage of Children in the Least Friendly Decile on the Friendliness Index |
| — | I Very bright | — |
| 4 | II Bright | 3 |
| 8 | III Normal | 5 |
| 14 | IV Dull | 11 |
| — | V Very Dull | 12 |
| 8 | All Whites | 6 |
Motor and social development is, in effect, a set of measures designed to capture whether the child is progressing in the ways described as normal in the baby manuals by Spock, Brazelton, et al The table below shows the results for children through the age of 3. The results look like a U-shaped curve, with a big jump in Class V Since sample sizes in both Class I and Class V are under 100 (75 and 81, respectively), this information falls in the category of interesting but uncertain.
For older children, the NLSY employed an instrument that measured behavioral problems, with subscales on antisocial behavior, depression,
headstrongness, hyperactivity, immature dependency, and peer conflict/social withdrawal. The table below shows the results for those who had the most severe problems—those in the worst 10 percent on these measures.
| Which White Children Are Behind in Motor and Social Development? | |
|---|---|
| Cognitive Class of the Mother | Percentage of Children in the Bottom Decile of the Motor & Social Development Index |
| I Very bright | 10 |
| II Bright | 5 |
| III Normal | 6 |
| IV Dull | 10 |
| V Very dull | 32 |
| All whites | 7 |
| Which White Children Have the Worst Behavioral Problems? | |
|---|---|
| Cognitive Class of the Mother | Percentage of Children in the Worst Decile of the Behavioral Problems Index |
| I Very bright | 11 |
| II Bright | 6 |
| III Normal | 10 |
| IV Dull | 12 |
| V Very dull | 21 |
| All whites | 10 |
Once again, there is the curious case of the elevated percentage for children of mothers in Class I. The most prudent assumption is that it is an artifact of small sample sizes, but the possibility remains that something else is going on worth investigating in greater detail, with larger samples.