Ancient DNA: Methods and Protocols (24 page)
Read Ancient DNA: Methods and Protocols Online
Authors: Beth Shapiro

2. Materials
1. Laboratory equipment: A standard set of equipment is required including calibrated pipettes, aerosol resistant tips, gloves, lint-free wipes, aluminum foil, a vortex mixer, and a microcentrifuge suitable for 1.5-mL and PCR strip tubes.
2. Plasticware: 1.5-and 0.5-mL microcentrifuge tubes are needed for reagent preparation. Thin-walled PCR strip tubes, with optical lids suitable for qPCR are required (see Note 1).
3. PCR primers suitable for qPCR: 10 μ M aliquots of both the forward and reverse PCR primers suitable for use in a qPCR
assay (see Note 2).
4. qPCR standard: 100 μ M solution of a synthetic oligonucle-
otide (see Notes 3 and 4; Fig. 2a ).
5. A solution of 10 mM Tris (pH 8.0) to use when diluting DNA extracts or standards.
6. SYBR Green dye: A 1:2,000 dilution of SYBR Green I
(10,000 × Nucleic Acid Gel Stain; Invitrogen catalogue number S7563) in molecular biology grade DMSO (see Note 5).
7. PCR reagents:
GeneAmp 10× PCR Buffer (Applied Biosystems).
dNTPs 25 mM of each nucleotide.
25 mM MgCl solution.
2
AmpliTaq Gold DNA polymerase (Applied Biosystems—see
Note 6).
Molecular biology grade H O.
2
Molecular biology grade bovine serum albumin (BSA)
10 mg/mL.

16 Quantitative Real-Time PCR in aDNA Research
125
454 A-adaptor (Lib-A)
454 Y-adaptor (Lib-L)
Forward Primer binding site
Forward Primer binding site
a
AT
CGTATCGCCTCCCTCGCGCCACCATCTCATCCCTGCGTGTC
ATCGGCTATCTCGACTCA TCTTGCGACGTAGCTATCGATCTTCGTCATCGCT
U
CAGCATTGCACTGCGTTCATCTAGG
CGTAACGAACGTTAATACGACTCCAACGAGT
GCGGGCTGGCAAGGCGCATAG
GATAC
454 B-adaptor (Lib-A)
CAAGGCACACAGGGGATAGG
CA
Reverse Primer binding site
454 Y-adaptor (Lib-L)
Reverse Primer binding site
b
c
1×10²
1×101
1×100, 1×10⁻¹, 1 ×10⁻²
C
C
T=33.8
T=37.2
CT=not detected
1×10³
CT=30.1
1×10⁴
CT=26.2
Value TC
1×10⁵
CT=22.3
1×10⁶
CT=18.8
Log copy number
Fig. 2. (
a
) Synthetic oligonucleotide (5¢ to 3¢) ordered for absolute quantitation of aDNA Roche 454 libraries. This is a universal standard as it has primer binding sites for both 454 A/B primers (Lib-A, marked by arrow) as well as Y-adaptor primers (Lib-L, marked by arrow). A single Uracil residue (U, underlined) is included in the middle of the sequence which allows the oligo to be inactivated by UNG in the event of contamination. (
b
) A qPCR assay of the synthetic oligo standard pictured in (
a
), using the A/B (Lib-A) primers. A 1/10 dilution series from 106 to 10−2 copies was placed in the reaction tubes and the
C
values T
recorded. (
c
) The
C
values from (
b
) are plotted against the log-transformed copy number to generate a regression line that T
can be used to extrapolate samples with unknown concentration from any
C
value. The optimal emPCR bead-to-template T
ratio based on your standard will need to be determined empirically when using this standard.
3. Methods
3.1. Preparation
Due to the high concentrations of standard templates involved,
of qPCR Standards
make up the synthetic oligonucleotide standard in a location that is separate from all molecular biology activities, and also separate from the aDNA clean room.
1. Vortex the 100 μ M stock oligonucleotide standard. Add 10 μ L
of this stock to 590 μ L of 10 mM Tris pH 8.0. This tube will (according to Avogadro’s number) contain 1 × 10 12 copies of single-stranded template per microliter.
2. In a series of 1/10 serial dilutions in 10 mM Tris pH 8.0 (being mindful of pipetting errors and contamination), obtain a set of standards that contains 1 × 10 6 –1 × 10 −2 copies per microliter.
126
M. Bunce
et al.
3. Test the synthetic standar
d using the qPCR assay (Fig. 2b ).
Add 2 μ L of the template (of the 1 × 10 6 –1 × 10 −2 copies per μ l stock solutions) to each reaction to obtain the concentrations that correspond to double-stranded DNA (see Note 7).
4. The standard curves should respond in a clear quantitative manner (approximately 3.3 cycle increase per 10× dilution) and should fail to amplify below zer
o copies (Fig. 2b
, see Note 8).
Perform the standard dilution series a number of times independently to ensure reproducibility.
5. Plot the log transformed concentration values against
C
, this 10
T
should generate a linear regression line with a high
R
2 value
(Fig. 2c ). This can be used to extrapolate the DNA copy number
from the
C
values of any unknown samples. A calculation of T
primer effi ciency should also be car
ried out—see http://www.
gene-quantifi cation.info/ and r
eferences therein (see Note 9).
3.2. Setting Up
1. Set up the qPCR assay in a DNA clean room (see Note 10).
the qPCR Reaction
Due to contamination risks, oligonucleotide standards should always be added in another laboratory after the reaction tubes containing aDNA extracts have been sealed in the clean room.
2. The following recipe provides a generic template for a 25 μ L
qPCR mix, but the reaction chemistry may need to be optimized (especially Mg 2+ and primer concentrations) depending on the specifi city of the assay. Mix the following reagents together (the “master mix”) in a 1.5-mL tube. The recipe
below is shown for one PCR reaction and will need to be scaled up to the number of required reactions.
GeneAmp 10× PCR buffer
2.5 μ L
dNTP’s, 25 mM of each nucleotide
0.25 μ L
25 mM MgCl solution
2.5 μ L
2
AmpliTaq Gold DNA polymerase
0.25 μ L (or 1–2 units)
Forward PCR primer (10 μ M)
1 μ L
Reverse PCR primer (10 μ M)
1 μ L
SYBR Green dye
0.6 μ L
BSA
1 μ L
Molecular biology grade H O
13.9 μ L
2
Template DNA (
omit from master mix!
)
2 μ L (to be added later)
Final volume
25 μ L
3. Ensure that all components are well mixed, especially the
Taq polymerase, which is stored in high concentrations of glycerol and can settle at the base of the tube.
16 Quantitative Real-Time PCR in aDNA Research
127
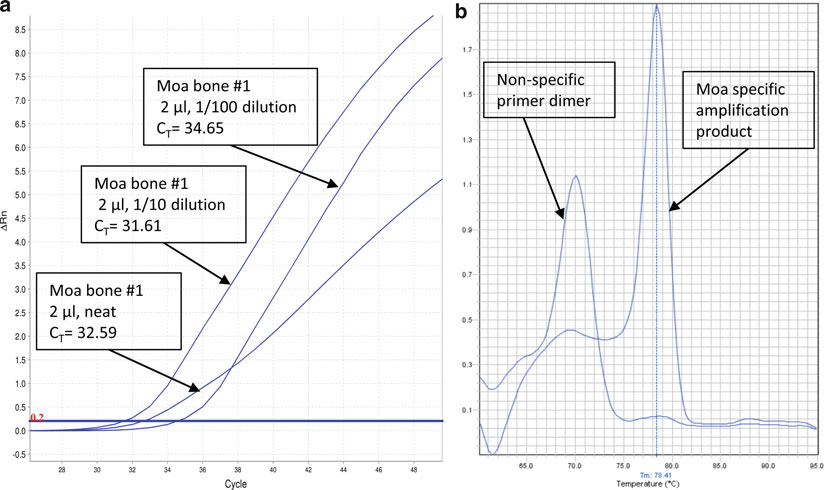
Fig. 3. (
a
) qPCR assay conducted on a moa bone that demonstrates the effect of PCR inhibitors. The “neat” extract is clearly compromised in this assay. In many instances, inhibited reactions fail to demonstrate any amplifi cation. (
b
) A melt-curve analysis of the assay shown in (
a
): the curve enables the user to easily discriminate between reactions yielding
bona fi de products and reactions that have been compromised by dimer formation. In many instances, the melt analysis will circumvent the need to run the PCR products on an agarose gel.
4. Carefully aliquot 23 μ L of master mix into each reaction tube.
Seal all the reaction tubes once 23 μ L have been dispensed.
5. Once sealed, identify the reaction tubes in an 8-strip by pen marks on the hinge region. It is
not
advisable to write on the top of the optical lid as the dye in the marker pen may interfere with the fl uorescence detection by the camera.
6. If not freshly extracted (see Note 11), thaw the aDNA extracts and let them equilibrate to room temperature. It may be necessary to construct dilution series (in 10 mM Tris, pH 8.0) on the DNA extracts to test the quantitative response, for example to make sure that inhibition is not affecting the results (e.g.,
Fig. 3a
).
7. In a separate area of the clean room (see Note 10), add 2 μ L
of template DNA to each reaction tube. Open tubes one at a time and close immediately after the addition to minimize
cross-contamination.
8. Transport the tubes wrapped in foil to PCR facility.
9. If required, add the qPCR standards or a positive control to the appropriate tubes. If adding a standard, it is advisable to begin by adding the most dilute DNA concentration (to minimize the 128
M. Bunce
et al.
risk of contamination from the highest concentration). Ensure the lids of all tubes are well sealed (see Note 12).
10. Pulse-spin the reaction tubes.
3.3. Thermocycling
There are many qPCR platforms available, all of which are equipped
on a qPCR Platform
to detect SYBR Green that has excitation and emission maxima of 494 and 521 nm, respectively. Follow the manufacturer’s instructions regarding loading and programming the specifi c qPCR platform.
During the loading process avoid the use of powdered gloves as the powder can adversely affect the fl uorescent detection.
1. Place reaction tubes into the thermocycler block, making sure that no air bubbles are present or that the reaction contents have not splashed up the side of the tube.
2. Once loaded, wipe the optical lids of the tubes with a lint-free tissue such as a kim-wipe.
3. Within the qPCR platform software, specify:
Which wells to monitor.
Which wells contain no template controls (NTCs).
If relevant, which wells contain standards.
Detection of SYBR Green dye (and passive reference dyes if relevant).
4. Program the thermocycling conditions for either a two-step PCR
protocol (e.g., 95°C/60°C) or three-step PCR protocol (e.g., 95°C/60°C/72°C) (see Note 13) for 40 cycles. Importantly,
the annealing temperature must be optimized specifi cally for each primer set to maximize effi ciency and minimize dimer.
5. Instruct the machine to execute a melt curve analysis (see Note 14) at the end of the 40 cycles. An example of a melt curve can
be found in Fig. 3b
.
6. If amplicons from the qPCR are to be used in any downstream applications (i.e., cloning or HTS amplicon library builds), a fi nal 72°C step (5–10 min) can be included to promote terminal adenylation.
7. Analyze the output of the qPCR run (see Note 15). Most qPCR software packages will automatically determine
C
T
values and the threshold level that generates these values. The threshold value needs to be standardized if
C
values are to be T
compared across different runs. By comparing
C
values from T
a dilution series, it is possible to detect inhibition (Fig. 3a ) and,
in the absence of inhibition, to determine which extracts have higher yields of DNA. Likewise, by using a standard curve
(e.g., a standard for Roche 454 library quantifi cation) it is possible to deter
mine the absolute number of molecules (Fig. 2a , b
) for an aDNA library.
16 Quantitative Real-Time PCR in aDNA Research
129
8. The publication of qPCR data (principally for gene expression studies) has recently undergone its own set of authentication criteria referred to as MIQE, or minimum standard for the
provision of information for qPCR experiments
( 11
) . Users of qPCR in aDNA research should be aware of the MIQE guidelines as they may, in time, impact on the ability to publish qPCR data.
4. Notes
1. The choice of appropriate plasticware is very important in qPCR. The use of 96-well plates and 8-strips with independent 8-strip lids may be problematic in an aDNA context as reactions cannot be sealed individually. We strongly advise the use of 8-strips with the attached lids (such as SnapStrip II PCR tubes, Anachem) so that each reaction tube can be opened and closed one at a time.