Cascadia's Fault (27 page)
Authors: Jerry Thompson

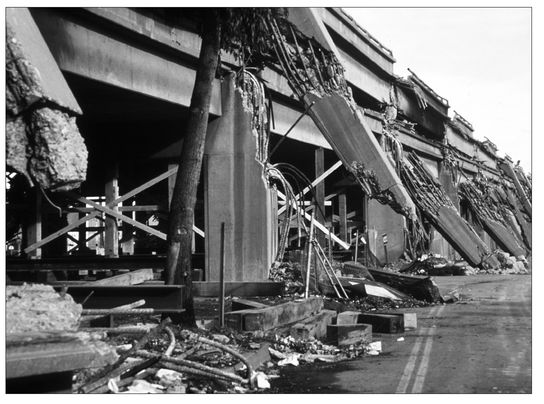
Â
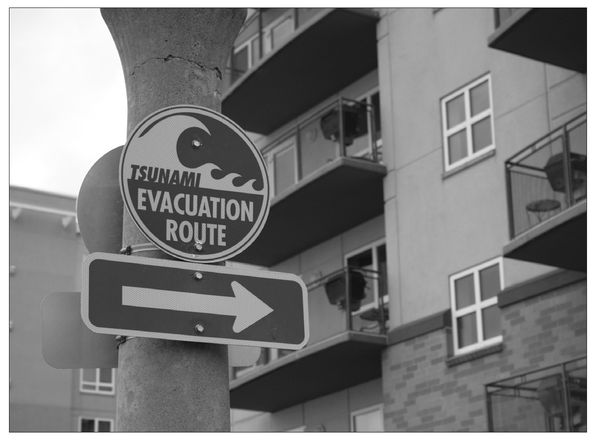
This photograph from March 2007 shows signs of a new public awareness of tsunami dangers on West Coast beaches. Residents of Seaside, Oregon, have learned the tsunami evacuation route and know they will have as little as fifteen minutes to leave the downtown core once a large quake on the nearby Cascadia Subduction Zone has begun. (
Doug Trent
)
Doug Trent
)
Â
Hauling a turbidite core sample aboard the research ship
Roger Revelle
off the coast of Sumatra in May 2007. Offshore landslides triggered by massive earthquakes have left a series of “tectonic fingerprints” in the deep-sea mud. (
Chris Aikenhead
)
Roger Revelle
off the coast of Sumatra in May 2007. Offshore landslides triggered by massive earthquakes have left a series of “tectonic fingerprints” in the deep-sea mud. (
Chris Aikenhead
)

Â
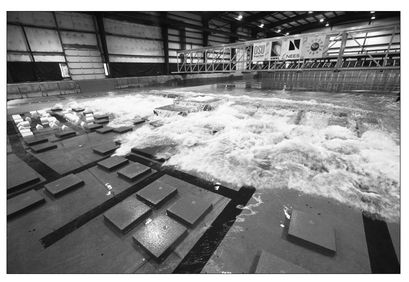
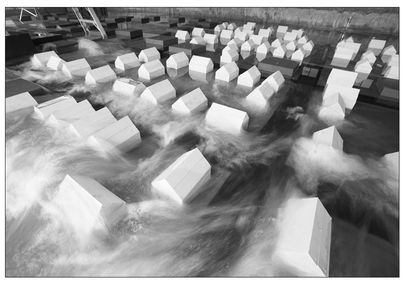
A tsunami simulation at Oregon State University in August 2007. Using a scale model of the resort community of Seaside, the simulation shows how a thirty-foot (10m) tsunami expected from a Cascadia Subduction Zone earthquake would sweep across the community, inundating nearly all the downtown business district and many residential areas. (
Omni Film Productions Ltd
.)
Omni Film Productions Ltd
.)
Â
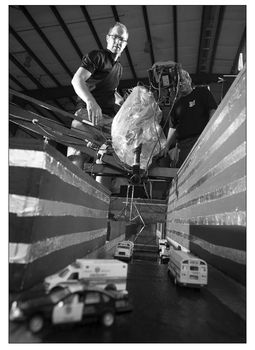
In August 2007 cinematographer Ian Kerr (left) prepares to record a tsunami simulation with a high-speed camera (protected by a plastic bag). The snorkel lens will provide a graphic, street-level view as the wave rips across this scale model of Seaside, Oregon. (
Omni Film Productions Ltd./Scott Spiker
)
Omni Film Productions Ltd./Scott Spiker
)
Â
A tsunami simulation in Seaside, Oregon, in August 2007. The wooden blocks represent residential dwellings, single-story commercial buildings, and multi-story condominiums or hotels. (
Omni Film Productions Ltd./Scott Spiker
)
Omni Film Productions Ltd./Scott Spiker
)
Â
Cascadia's wave makes landfall on the west coast of Vancouver Island in a computer-generated tsunami simulation created in 2008 for the documentary
Shockwave
. The first of several tsunami waves can be expected to hit areas from British Columbia to California fifteen to twenty minutes after the earthquake. (
Omni Film Productions Ltd./Artifex Studios
)
Shockwave
. The first of several tsunami waves can be expected to hit areas from British Columbia to California fifteen to twenty minutes after the earthquake. (
Omni Film Productions Ltd./Artifex Studios
)

Â
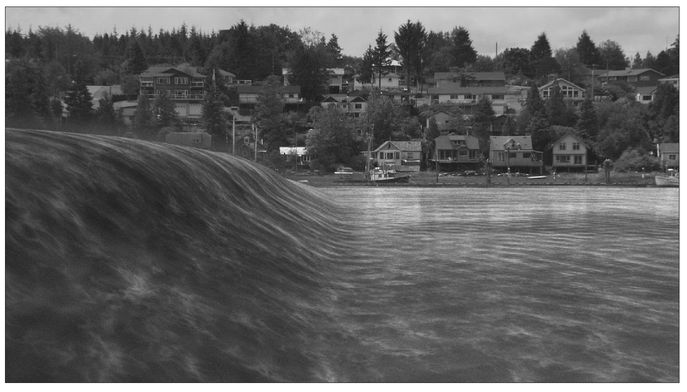
A computer-generated illustration from the documentary
Shockwave
(2008) shows the leading edge of a tsunami generated by a megathrust earthquake along Cascadia's fault. The tsunami arrives in Ucluelet harbor on the west coast of Vancouver Island fifteen to twenty minutes after the shaking stops. (
Omni Film Productions Ltd./Artifex Studios
)
Shockwave
(2008) shows the leading edge of a tsunami generated by a megathrust earthquake along Cascadia's fault. The tsunami arrives in Ucluelet harbor on the west coast of Vancouver Island fifteen to twenty minutes after the shaking stops. (
Omni Film Productions Ltd./Artifex Studios
)
CHAPTER 15
Defining the Zone: Hot Rocks and High Water
Decades of terror, or the magnitude 9 scenarioâwhich will it be for Cascadia's fault? Apparently Gary Carver and Brian Atwater took enough flak from some of their colleagues for using such terms to describe the possible fate of the Pacific Northwest that they decided to tone down the language in subsequent talks. They started referring somewhat in jest to the biggest, full-margin ruptureâthe magnitude 9 scenarioâas a “dinner sausage” earthquake and the series of slightly smaller magnitude 8s as being “breakfast links.” The question of which scenario was more likely to happen remained unanswered and vigorously debated.
Early in the new year of 1994, in the AGU's
Journal of Geophysical Research,
a team of scientists at the Geological Survey of Canada took a stab at defining how much of the subduction zone was locked together and which parts might be moving along smoothly. Presumably, if you knew how much of the zone was lockedâif there were some way to measure and define itâyou might be able to estimate the size of the rupture that would be generated when the thing finally came unstuck. Drawing a line around the “seismogenic zone” would tell emergency
planners how close the quake's epicenter was going to be to major urban areas like Vancouver, Victoria, Seattle, and Portland.
The Canadian team gathered and distilled all the latest reports from both sides of the international border that showed how much the outer coast was being lifted up, dropped down, or squeezed together. Then they plotted the boundaries of each type of data to show exactly where the western edge of the continent was being deformed and in what direction. Herb Dragert's laser and GPS surveys were coming to a sharp new focus. Garry Rogers plotted decades of seismic events that showed where all the coastal earthquakes had been and how deep their epicenters were. These overlapping maps of strain and epicentral data points formed the rough outline of the locked subduction zone.
The first thing that jumped out from this updated, multilayered mass of evidence was the idea that the built-up strain and deformation along the western edge of the continent had to be “transient.” The strain was obviously getting released from time to time. The rates at which the coastline was being lifted and the mountains tiltedâbut especially the speed at which the ground was being squeezed horizontallyâwere considered “geologically unreasonable.” If the hoisting and crunching had continued at this rate with no interruptions for a million years, the mountains along the west coast would be several
miles
higher than they are now and would look much like the Himalayas.
miles
higher than they are now and would look much like the Himalayas.
The fact that the peaks of southern Vancouver Island, the Olympic Peninsula in Washington, and the Coast Range in Oregon and California are
not
towering piles like Mount Everest could be taken as one more level of proof that the nonstop pressure of subduction must have been released every few hundred years by very large earthquakes. The point of this latest study was to find the edges of the locked part of the zone and figure out how much real estate was likely to slip sideways when the two plates come unstuck next time.
Roy Hyndman and Kelin Wang, coauthors with Dragert and Rogers, had been working for several years on the idea that temperature could
tell the story of where these two plates of rock were bonded together by friction and where they were sliding along smoothly. Wang told me that the dangerous part of a subduction zoneâthe area that can generate an earthquakeâcannot be very far below the surface. “It doesn't go very deep,” he said, “because when they go deeper and the temperature is too high, the rock becomes too soft to produce earthquakes.”
tell the story of where these two plates of rock were bonded together by friction and where they were sliding along smoothly. Wang told me that the dangerous part of a subduction zoneâthe area that can generate an earthquakeâcannot be very far below the surface. “It doesn't go very deep,” he said, “because when they go deeper and the temperature is too high, the rock becomes too soft to produce earthquakes.”
Other books
Murder and Salutations by Elizabeth Bright
In Bed with a Spy by Alyssa Alexander
Biker Beach 1: Forbidden Ride by Archer, Lexi
El hijo del lobo by Jack London
Vicki's Work of Heart by Rosie Dean
Dying to Score by Cindy Gerard
Dios en una harley: el regreso by Joan Brady
Her Alpha Lover: A Draken and Charli Boxed Set by Richensexi, Amanda
The Confession by John Grisham
Knowledge: The Fifth Division Saga: Book 1 by Kira Stüssy
