iOS Programming: The Big Nerd Ranch Guide, 3/e (Big Nerd Ranch Guides) (71 page)
Read iOS Programming: The Big Nerd Ranch Guide, 3/e (Big Nerd Ranch Guides) Online
Authors: Aaron Hillegass,Joe Conway
Tags: #COM051370, #Big Nerd Ranch Guides, #iPhone / iPad Programming

Click on the
Line
item in the breadcrumb bar to get back to the list of all
Line
instances. Click on a single instance and then click the arrow icon on that row. This will show you the history of this object. There are two events: when the
Line
was created and when it was destroyed. You can select an event row to see the stack trace that resulted in the event in the extended detail area.
Let’s look at some of the options in the
Allocations
instrument. First, click the
Stop
button in the top left corner of the
Instruments
window. (The options we are going to configure must be set before
Instruments
begins monitoring the application.)
Click the info button next to the
Allocations
tool underneath the
Stop
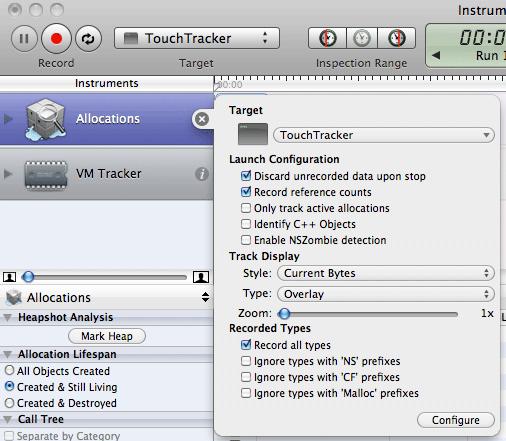
button. This will show a panel with the settings for the
Allocations
instrument: check the box for
Record reference counts
(
Figure 21.13
).
Figure 21.13 Enable recording of reference counts

The
Record reference counts
option instructs
Instruments
to note every time an object gains or loses an owner. Click the red
Record
button again to start profiling with this option turned on. (
Instruments
can’t build an application itself, so it uses the most recent build from
Xcode
.)
Draw some lines in
TouchTracker
and then double-tap to delete them. Now select the
Line
row and click the arrow next to it. Then select one of the
Line
instances that appear and click its arrow. This new table shows you the reference count history of an individual
Line
object (
Figure 21.14
).
Figure 21.14 Object’s lifespan

You’ve seen this information before, but after turning on
Record reference counts
, there is much more of it. Each time the selected
Line
instance gained an owner, a
Retain
event was added to this table. Each time the line lost an owner, a
Release
event was added to the table. The
RefCt
column tells you the number of owners a
Line
has after that event. You can click on a row to see the stack trace that caused that event.
The last item we’ll examine in the
Allocations
instrument is
Heapshot Analysis
. First, clear the search box so that you aren’t filtering results anymore. Then, find the
Heapshot Analysis
category on the left side of the
Instruments
window and click
Mark Heap
. A category named
Baseline
will appear in the table. You can click the disclosure button next to this category to see all of the allocations that took place before you marked the heapshot. Now draw more lines in
TouchTracker
and click
Mark Heap
again. Another category will appear named
Heapshot 1
. Click the disclosure button next to
Heapshot 1
(
Figure 21.15
).
Figure 21.15 Heapshot

Every allocation that took place after the first heapshot is in this category. You can see the
Line
instances that you just created as well as a few objects that were used to handle other code during this time. You can take as many heapshots as you like; they are very useful for seeing what objects get allocated for a specific event. Double-tap the screen in
TouchTracker
to clear the lines and notice that the objects in this heapshot disappear.
To return to the full object list where we started, select the pop-up button in the breadcrumb bar that currently says
Heapshots
and change it to
Statistics
.
The
Time Profiler
instrument finds wasted CPU cycles in an application. To see how this works, add the following CPU cycle-wasting code to the end of your
drawRect:
method:
for (int i = 0; i < 1000; i++) {
f = f + sin(sin(time(NULL) + i));
}
NSLog(@"f = %f", f);
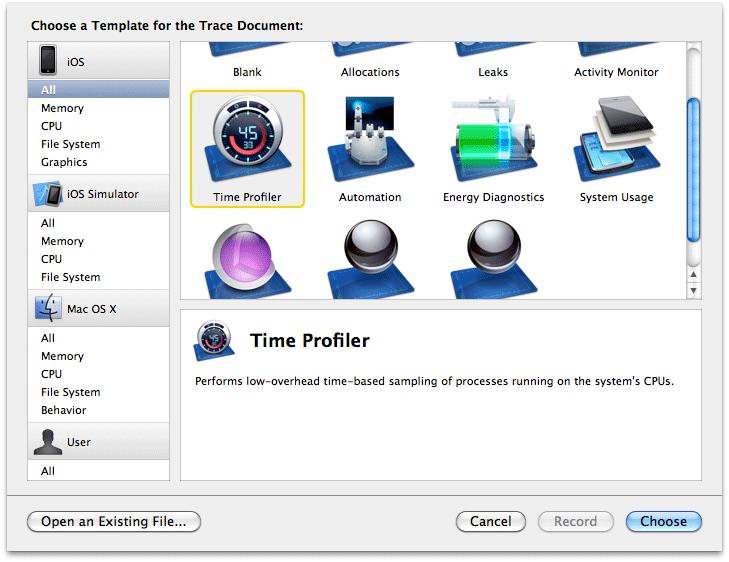
Build and profile the application. When
Instruments
asks which instrument to use, choose
Time Profiler
(
Figure 21.16
). When
Instruments
launches the application and its window appears, make sure that all three areas are visible by clicking the buttons in the
View
control to blue.
Figure 21.16 Time Profiler instrument

Touch and hold your finger on the
TouchTracker
screen. Move your finger around but keep it on the screen. This sends
touchesMoved:withEvent:
over and over to the
TouchDrawView
. Each
touchesMoved:withEvent:
message causes
drawRect:
to be sent, which in turn causes the silly
sin
code to run repeatedly.
As you move your finger, watch the table in
Instruments
shuffle around its items. Then click the pause button (to the left of the
Stop
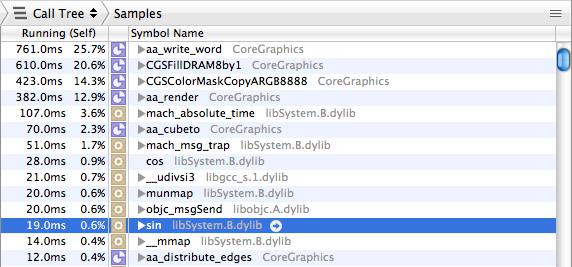
button) and examine the table’s contents. Each row is one function or method call. In the left column, the amount of time spent in that function (expressed in milliseconds and as a percentage of the total run time) is displayed (
Figure 21.17
). This gives you an idea of where your application is spending its execution time.
Figure 21.17 Time Profiler results

There is no rule that says,
“
If X percentage of time is spent in this function, your application has a problem.
”
Instead, use
Time Profiler
if you notice your application acting sluggish while testing it as a user. For example, you should notice that drawing in
TouchTracker
is less responsive since we added the wasteful
sin
code.
We know that when drawing a line, two things are happening:
touchesMoved:withEvent:
and
drawRect:
are being sent to the
TouchDrawView
view. In
Time Profiler
, we can check to see how much time is spent in these two methods relative to the rest of the application. If an inordinate amount of time is being spent in one of these methods, we know that’s where the problem is.
(Keep in mind that some things just take time. Redrawing the entire screen every time the user’s finger moves, as is done in
TouchTracker
, is an expensive operation. If it was hindering the user experience, you could find a way to reduce the number of times the screen is redrawn. For example, you could redraw only every tenth of a second regardless of how many touch events were sent.)
Time Profiler
shows you nearly every function and method call in the application. If you want to focus on certain parts of the application’s code, you can prune down its results. For example, sometimes the
mach_msg_trap
function will be very high on the sample list. This function is where the main thread sits when it is waiting for input. It is not a bad thing to spend time in this function, so you might want to ignore this time when looking at your
Time Profiler
results.
Use the search box in the top right corner of the
Instruments
window to find
mach_msg_trap
. Then, select it from the table. On the left side of the screen, click the
Symbol
button under
Specific Data Mining
. The
mach_msg_trap
function appears in the table under
Specific Data Mining
, and the pop-up button next to it displays
Charge
. Click on
Charge
and change it to
Prune
. Then, clear the text from the search box. Now, the list is adjusted so that any time spent in
mach_msg_trap
is ignored. You can click on
Restore
while
mach_msg_trap
is selected in the
Specific Data Mining
table to add it back to the total time.
Figure 21.18 Pruning a symbol

Other options for reducing the list of symbols in
Time Profiler
include showing only Objective-C calls, hiding system libraries, and charging calls to callers. The first two are obvious, but let’s look at charging calls to callers. Select the row that holds
mach_absolute_time
. (If you are running on the simulator, select
_nanotime
instead.) Then, click the
Symbol
button. This function disappears from the main table and reappears in the
Specific Data Mining
table. Notice that it is listed as a
Charge
. This means that the time spent in this function will be attributed to the function or method that called it.
Back in the main table, notice that
mach_absolute_time
has been replaced with the function that calls it,
gettimeofday
. If you take the same steps to charge
gettimeofday
, it will be replaced with its caller,
time
. If you charge
time
, it will be replaced with its caller,
drawRect:
. The
drawRect:
method will move to near the top of the list; it now is now charged with
time
,
gettimeofday
, and
mach_absolute_time
.
Some common function calls always use a lot of CPU time. Most of the time, these are harmless and unavoidable. For example, the
objc_msgSend
function is the central dispatch function for any Objective-C message. It occasionally creeps to the top of the list when you are sending lots of messages to objects. Usually, it’s nothing to worry about. However, if you are spending more time dispatching messages than actually doing work in the triggered methods
and
your application isn’t performing well, you have a problem that needs solving.
As a real world example, an overzealous Objective-C developer might be tempted to create classes for things like vectors, points, and rectangles. These classes would likely have methods to add, subtract, or multiply instances as well as accessor methods to get and set instance variables. When these classes are used for drawing, the code has to send a lot of messages to do something simple, like creating two vectors and adding them together. The messages add excessive overhead considering the simplicity of the operation. Therefore, the better alternative is to create data types like these as structures and access their memory directly. (This is why
CGRect
and
CGPoint
are structures and not Objective-C classes.)
Don’t forget to remove the CPU cycle-wasting code in
drawRect:
!
