Simply Complexity (9 page)
Authors: Neil Johnson

Further increasing
r
toward
r
= 3.6 gives a time-series of period eight, then sixteen, then thirty-two. In fact it keeps doubling in this way until the period is so long that it looks like it never repeats itself. And this is just like the Chaos that we saw earlier for
r
= 4. In fact, Chaos can simply be seen as a periodic pattern whose period is so long, that the pattern never repeats itself. Now that really is remarkable behavior, by anybody’s standards.
We can represent all this with a special type of diagram which shows the final shelf locations, i.e. the
S
values, for different values of
r
. Since it is easy to work out these final
S
values as long as you have a calculator lying around, we might as well go ahead and plot the final
S
values for all
r
values at the same time. The result is shown schematically in
figure 3.2
and what it means is
this: pick a value for r, and find it on the horizontal line. Then look straight up vertically to read off the corresponding values of the black lines. These are the final shelf locations, i.e. the
S
values, between which the file will end up bouncing forever – these shelves, and no others. So, for example, take the case
r
= 3.2 which we considered earlier. Find this value on the horizontal line in the diagram. Then if you look straight up, you will find the two values 0.51 and 0.80 which are the two values which keep repeating themselves in the time-series:
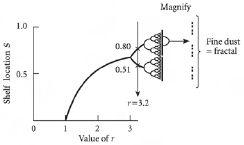
Figure 3.2
A schematic diagram showing the shelf location where the file ends up after many steps, for a range of
r
values. As the
r
value increases above 3, the number of locations that the file ends up moving between doubles rapidly. In the region of
r
= 3.6, which is shown magnified, the number of locations becomes so large that the value of
S
never seems to repeat itself. For this reason, the pattern ends up looking like a solid line. But it isn’t solid. Instead it is like an extremely fine dust containing many, many points. It is called a “fractal”. For
r
values from 3.6 to 4 (not shown) the dynamics remain chaotic, apart from occasional glimpses of periodic behavior.
. . . 0.80 0.51 0.80 0.51 0.80 . . .
For values of
r
near 3.6, the file ends up perpetually moving between different locations with the associated value of
S
never repeating itself. As a result, there seem to be so many points on the diagram that it looks like a solid vertical line. But it isn’t – instead it is like a very fine dust of points. And here comes something
rather peculiar: there are actually an infinite number of points, and an infinite number of gaps. So this apparent line, which is shown magnified on the right-hand side of
figure 3.2
, is between being an infinite set of points and a solid line. Now, it turns out that scientists refer to a point as being zero-dimensional, a line as being one-dimensional, and a flat sheet such as a television screen as being two-dimensional. This fine dust of points which looks like a solid line but isn’t, is effectively between a point and a line – hence it is between a zero-dimensional object and a one-dimensional object. As we all know, a number between zero and one is called a fraction – hence the fine dust of points has a fractional dimension. For this reason, scientists call an object such as this fine dust of points, a fractal.
You can also see a repeated pitchfork shape emerge as the value of
r
increases toward 3.6. Each line splits into two – and this repeats itself on an ever smaller scale. It is equivalent to saying that the period keeps doubling from 2 to 4 to 8 etc. As we noted above, the final object is a line of points – like a dust of points – which would look to your eye as you move toward the page as “points within points within points”. Here we have the same thing: a pitchfork-like pattern within a pitchfork-like pattern within a pitchfork-like pattern. This pattern-within-a-pattern repeated over and over is again referred to as a fractal.
This emergence of fractals is a common occurrence in Complex Systems, both in terms of the output which a Complex System produces in time and the resulting shapes which emerge in space. In other words, fractals are a typical emergent phenomenon of Complex Systems. Just as with Chaos, this does not mean that fractals are always observed in a Complex System – just that they can be. Given this widespread interest in fractals, the two boxes marked “Fractal Fun” show a couple of ways in which you can generate fractals using just a pen and paper. This is not how real-world Complex Systems actually generate their fractals – far from it, since there are many ways of generating the same fractal. But they do help illustrate what a fractal is.
Suppose that our systematic intern is now dictating the price of some commodity in a market, as opposed to dictating the location of a file. The position of the file
S
becomes the market price.
Instead of a time-series of file locations as we had above, we would have a series of prices – a price time-series. The rich variety of behavior that this price series could then show is indeed consistent with the wide range of behaviors that we see emerging from financial markets – from moments where the price doesn’t seem to change (e.g.
r
= 0.1), to moments where it appears to oscillate back and forth in a so-called business cycle (e.g.
r
= 3.2), through to moments where it appears to be random (e.g.
r
= 4). In other words if our intern-turned-price-maker increased the value of
r
from zero to four, the price would range in behavior from something that never changed over time, to something that repeated itself, to something that looked quite simply chaotic.
Fractal Fun I: Dust to dust
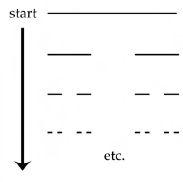
The figure above shows how to produce a dust-like fractal. Start by drawing a horizontal line. Divide it into three, and remove the middle piece. This leaves you with a straight line with a hole in the middle. In fact the easiest way to do this, is to draw the new shape you generate in an empty space below the present shape, as shown. Treating each of the two resulting pieces as a new line, divide each one into three and again remove the middle piece. Keep repeating this process over and over again, for as long as you can. You will end up with a fine dust of points – in other words, a fractal having a fractal dimension between zero and one. This fractal looks very similar to the one that turns up in the regime of Chaos in
figure 3.2
.
Fractal Fun II: Let it snow, let it snow, let it snow
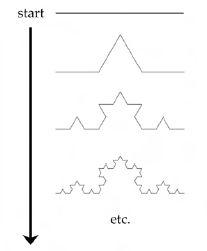
The figure above shows how to produce a snowflake-like fractal. Start by again drawing a horizontal line. Divide it into three, but now replace the middle piece by two pieces which are equal in length to the removed piece. This leaves you with a straight line with a hat shape in the middle, as shown. Treating each of the resulting pieces as a new line, divide each one into three and again replace the middle piece by two pieces of equal length. Keep repeating this over and over again. This time the fractal looks like it contains so may lines that it begins to fill the page. In other words, this snowflake-like structure has a fractal dimension between one and two. Similar shapes can arise in many real-world systems – for example, the border of a cancer tumor.
Now, if all this can happen with such a simple setup as one systematic intern and a filing cabinet, imagine what could happen in a system containing a collection of such people or objects? The short answer is “all this and more”. But don’t worry – we haven’t been wasting our time. It turns out that the range of behaviors which arise in this simple example tend to be ones that are often observed in real-world Complex Systems. For example, the heart is a Complex System containing a collection of cells which are interacting in a complicated way, with feedback. The result is an output which seems to oscillate, or “beat”, in a fairly ordered way – but it can occasionally behave erratically. Meanwhile a market price is typically random looking – but it can occasionally appear more regular with oscillatory-type behavior emerging every so often.
We just saw how a systematic intern could generate Chaos, and hence fractals, in the location of a file in a filing cabinet. I also gave you two mathematical rules which had nothing to do with files or interns, but which still managed to generate fractals. Now let’s have a look at those fractals again. One could argue that the dust-like fractal shown in
figure 3.2
and in “Fractal Fun I”, looks a bit like traffic seen from way up in the sky – or even a trail of ants. And the snowflake-like fractal in “Fractal Fun II” could be said to
look like the coastline of an island. Its jaggedness might also make you think a bit about mountain ranges, or even those stock price-charts that we mentioned. Because of this apparent similarity, it is precisely at this stage of the discussion of Complexity that many articles and books on the subject tend to stop dead. Here is their reasoning: a systematic rule can produce Chaos; Chaos has fractals in it; fractals look a bit like things we see all around us; so they must all be one and the same thing. Case closed.
But that kind of reasoning does very rough justice to the whole Complexity mystery. Indeed just like an investigation into a crime, where finding one possible motive doesn’t mean we have found
the
motive, finding one possible way of generating complex emergent behavior doesn’t mean we have found
the
way it is actually generated in real-world Complex Systems. Just take the dust-like fractal, and think of traffic. Fractal patterns are indeed observed occasionally in everyday traffic – however there is no systematic intern organizing the traffic and thereby producing the observed fractal pattern. Nor is the line of drivers on the road magically dividing itself into three, removing the middle section, and hence going through the fractal-generating rule I gave you in the previous section. Even though it is encouraging to have shown that relatively simple rules can give such phenomena, it in no way explains how a Complex System comprising many interacting parts, manages to produce such phenomena. This is precisely the reason why this book won’t go the route that so many others have by focusing on different types of mathematical rules for producing non-linear dynamical phenomena such as Chaos and fractals. There is already a branch of science that does that, and people like Steve Strogatz have written excellent articles and books on such machinery and effects.
So, even though the examples in this chapter have helped us understand the range of behaviors that a real-world Complex System can show, they are far from the end of the story. In short, the behavior of real-world Complex Systems is even more complicated than the behavior produced by repeatedly applying a single mathematical rule, for the following reasons: