The Bell Curve: Intelligence and Class Structure in American Life (30 page)
Read The Bell Curve: Intelligence and Class Structure in American Life Online
Authors: Richard J. Herrnstein,Charles A. Murray
Tags: #History, #Science, #General, #Psychology, #Sociology, #Genetics & Genomics, #Life Sciences, #Social Science, #Educational Psychology, #Intelligence Levels - United States, #Nature and Nurture, #United States, #Education, #Political Science, #Intelligence Levels - Social Aspects - United States, #Intellect, #Intelligence Levels

Everyday experience bears out this finding for people who live in academic communities or professional circles, where they see many smart men and women in their 30s and 40s who are still single and look as if they might stay that way forever. The intelligent professional woman is the most visible of this new tribe, rising in her career, too busy for, or not interested in, marriage and children. Among men, other images have recently become part of the culture: the intelligent, successful, and unmarried heterosexual male who cannot make a commitment and the intelligent, successful, and unmarried homosexual male who no longer needs to go through the motions of a marriage.
At the other end of the scale, there are similar reasons in research and common sense to suggest that marriage rates will tend to be low among people at the very bottom of the IQ distribution.
4
For a number of reasons, having to do with everything from initiative to romance to economics, people with very low IQs are likely to be at a disadvantage in competing for marriage partners.
Our first look at the NLSY data conforms to these expectations, though not dramatically. The next table shows the situation for the NLSY sample among whites who had reached the age of 30. There were surprises in these results for us, and perhaps for some of our readers. We would not have guessed that the average age of marriage for people in the top 5 percent of the intelligence distribution was only 25, for example.
5
A main point of the table is to introduce the theme threaded throughout the chapter: Our, your, and the media’s impressions of the state of the American family are not necessarily accurate.
Note in the table below that marriage percentages are highest for people in the middle of the intelligence distribution and taper off on both ends. The same is true, though less dramatically, if the table is constructed by socioeconomic class: The percentage of whites who had married before the age of 30 declines at both extremes. Furthermore, we have good reasons for thinking that this pattern is not a sampling fluke
but reflects underlying dynamics of marriage. This pattern makes interpreting regression results tricky, because the regression techniques we are using compute the lines in the graphs based on the assumption that the lines are not trying to make U-turns. For the record: When we run the standard initial analysis incorporating IQ, age, and socioeconomic status as predictors of marriage, IQ has no significant independent role; there is a slight, statistically insignificant downward probability of marriage as IQ goes up. Socioeconomic background has a much larger suppressive role on marriage: The richer and better educated your parents, the less likely you are to marry, according to these results, which, again, must be interpreted cautiously.
| Which Whites Get Married When? | ||
|---|---|---|
| Percentage Who Had Ever Married Before Age 30 | Cognitive Class | Average Age at First Marriage |
| 67 | I Very bright | 25.4 |
| 72 | II Bright | 24.3 |
| 81 | III Normal | 22.9 |
| 81 | IV Dull | 21.5 |
| 72 | V Very Dull | 21.3 |
| 78 | Overall averages | 22.1 |
The real culprit in explaining marriage rates in a young population is education. In the rest of the chapters of Part II, we point out many instances in which taking education into account does not much affect IQ’s independent role. Not so with marriage. When we take education into account, the apparent relationship reverses: The probability of marrying goes up, not down, for people with high IQs—a result found in other databases as well.
6
Our standard analysis with the two educational samples, high school graduates (no more and no less) and college graduates (no more and no less) elucidates this finding.
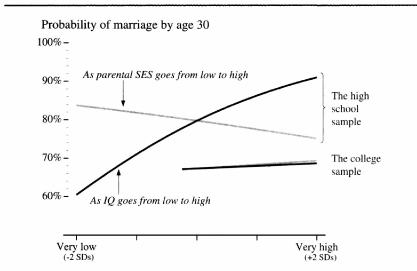
The next figure shows that neither IQ nor socioeconomic background was important in determining marriage for the college sample. In sharp
contrast, IQ made a significant difference in the high school sample. A high school graduate from an average socioeconomic background who was at the bottom of the IQ distribution (2 standard deviations below the mean) had a 60 percent chance of having married. A high school graduate at the top of the IQ distribution had an 89 percent chance of having married. Meanwhile, the independent role of socioeconomic status in the high school sample was either slightly negative or nil (the downward slope is not statistically significant).
High IQ raises the probability of marriage for the white high school sample, while high socioeconomic background lowers it
Note:
For computing the plot, age, and either SES (for the black curves) or IQ (for the gray curves) were set at their mean values.
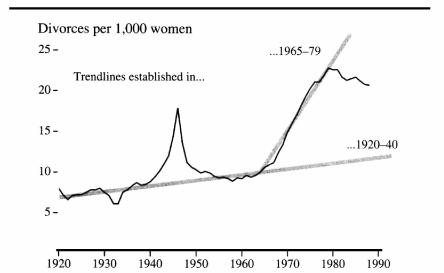
People marry, but do they stay married? Here is where the change has been not only dramatic but, some would say, cataclysmic, as shown below. In 1920, only death parted husbands and wives in about 82 percent of marriages and, in any given year (the datum shown in the next figure below), only about 8 out of 1,000 married females experienced a divorce. As late as 1964, despite the sweeping changes in technology,
wealth, and social life that had occurred in the intervening forty-four years, the number was very little changed: 10 of every 1,000. The peak divorce rates just following World War II had fully subsided, and the divorce rate still lay upon a trendline established between 1920 and 1940.
The divorce revolution
Sources:
U.S. Bureau of the Census, 1975, Table B214-215;
SAUS,
1992, Table 127, and comparable table in various editions.
Then came the revolution. The steep upward sweep of the divorce rate from the mid-1960s through the end of the 1970s represents one of the most rapid, compressed changes in a basic social behavior that the twentieth century has witnessed. When the divorce rate hit its peak at the end of the 1970s, a marriage had more than a fifty-fifty chance of ending in divorce.
7
Despite a downward trend since 1980, divorce remains at twice the annual rate of the mid-1960s.
We do not attempt to explain this profound change in our lives, which no doubt has roots in changing mores, changing laws, changing roles of women, changing labor markets, and who knows what else. Instead, we address the narrow question: How does divorce currently correlate with intelligence?
There are plausible reasons for expecting that cognitive ability will have an impact on divorce. For example, one may hypothesize that bright people less often marry on a whim, hence they have fewer disastrous short marriages. Bright people are perhaps less likely to act on impulse when the marriage has problems, hence are less likely to divorce precipitously during the first years of marriage. More generally, it may be argued that brighter people are better able to work out differences that might otherwise eventually destroy a marriage. We are, of course, referring to statistical tendencies for which individual exceptions abound.
Within the confines of the NLSY experience, these expectations are borne out to some degree, as shown in the table. The results are based on the first five years of marriage. Those in Class I were ten times as likely to stay married for at least five years as to get divorced; for those in Classes III, IV, and V—the bottom three-quarters of the population—the ratio of marital survival to divorce for at least five years was only 3.5 to 1.
8
Virtually all of the effect of IQ seems to have been concentrated at the top of the distribution. The divorce rates across the bottom three-quarters of the cognitive ability distribution were essentially identical.
| Which Whites Get Divorced When? | |
|---|---|
| Cognitive Class | Percentage Divorced in First Five Years of Marriage |
| I Very bright | 9 |
| II Bright | 15 |
| III Normal | 23 |
| IV Dull | 22 |
| V Very dull | 21 |
| Overall averages | 20 |
Do these findings hold up when we begin to add in other considerations? The figure below shows the results for the white sample who had been married at least five years.
9
The consistent finding, represented fairly by the figure, was that higher IQ was still associated with a lower probability of divorce after extracting the effects of other variables, and parental SES had a significant
positive
relationship to divorce—that is,
IQ being equal, children of higher-status families were more likely to get divorced than children of lower-status families.
10
IQ and socioeconomic background have opposite effects on the likelihood of an early divorce among young whites
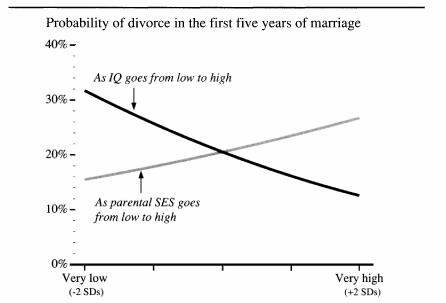
Note: In addition to IQ, age, and parental SES, the independent variables included date of first marriage. For computing the plot, age, date of first marriage, and either SES (for the black curve) or IQ (for the gray curve) were set at their mean values.
It is clear to all researchers who examine the data that higher education is associated with lower levels of divorce. This was certainly true of the NLSY, where the college sample (persons with a bachelor’s degree, no more and no less) had a divorce rate in the first five years of marriage that was less than half that of the high school sample: 7 percent compared to 19 percent. But this raw outcome is deceptive.
11
Holding some critical other things equal—IQ, socioeconomic status, age, and date of marriage—the divorce rate for the high school graduates in the first five years of marriage was
lower
than for college graduates.
For whom did IQ make more difference: the high school sample or the college sample? The answer is the college sample, by far. For them, the probability of divorce in the first five years plunged from 28 percent for someone with an IQ of 100 to 9 percent for someone with an IQ of 130. The much more minor effect of IQ among high school graduates was not statistically significant.
12
One other cause of divorce is mentioned so commonly that it requires exploration: a broken home in the preceding generation. The children of divorced parents have an elevated risk themselves of getting divorced.
13
It is not hard to think of reasons why: They have not witnessed how a successful marriage works, they are more likely to see divorce as an acceptable alternative, the turbulence of a failing marriage leaves psychological scars, and so forth.
14