Read The Bell Curve: Intelligence and Class Structure in American Life Online
Authors: Richard J. Herrnstein,Charles A. Murray
Tags: #History, #Science, #General, #Psychology, #Sociology, #Genetics & Genomics, #Life Sciences, #Social Science, #Educational Psychology, #Intelligence Levels - United States, #Nature and Nurture, #United States, #Education, #Political Science, #Intelligence Levels - Social Aspects - United States, #Intellect, #Intelligence Levels
The Bell Curve: Intelligence and Class Structure in American Life (53 page)

Changing cognitive ability through environmental interventions has proved to be extraordinarily difficult. At best, the examples of special programs that have permanently raised cognitive ability are rare. Perhaps as time goes on we will learn so much about the environment, or so much about how intelligence develops, that effective interventions can be designed. But this is only a hope. Until such advances in social interventions come about, which is unlikely to happen any time soon, it is essential to grasp the point made earlier in the book: A short person who could have been taller had he eaten better as a child is nonetheless really short. The corn planted in the Mojave Desert that could have flourished if it had been planted in Iowa, wasn’t planted in Iowa, and there’s no way to rescue it when it reaches maturity. Saying that a difference is caused by the environment says nothing about how real it is.
Aren’t genetic differences passed down through the generations, while environmental differences are not?
Yes and no. Environmentally caused characteristics are by definition not heritable in the narrow technical sense that they do not involve genetic transmission. But nongenetic characteristics can nonetheless run in families. For practical purposes, environments are heritable too. The child who grows up in a punishing environment and thereby is intellectually stunted takes that deficit to the parenting of his children. The learning environment he encountered and the learning environment he provides for his children tend to be similar. The correlation between parents and children is just that: a statistical tendency for these things to be passed down, despite society’s attempts to change them, without any necessary genetic component. In trying to break these intergenerational links, even adoption at birth has its limits. Poor prenatal nutrition can stunt cognitive potential in ways that cannot be remedied after birth. Prenatal drug and alcohol abuse can stunt cognitive potential. These traits also run in families and communities and persist for generations, for reasons that have proved difficult to affect.
In sum: If tomorrow you knew beyond a shadow of a doubt that all the cognitive differences between races were 100 percent genetic in origin, nothing of any significance should change. The knowledge would give you no reason to treat individuals differently than if ethnic differences were 100 percent environmental. By the same token, knowing
that the differences are 100 percent environmental in origin would not suggest a single program or policy that is not already being tried. It would justify no optimism about the time it will take to narrow the existing gaps. It would not even justify confidence that genetically based differences will not be upon us within a few generations. The impulse to think that environmental sources of difference are less threatening than genetic ones is natural but illusory.
In any case, you are
not
going to learn tomorrow that all the cognitive differences between races are 100 percent genetic in origin, because the scientific state of knowledge, unfinished as it is, already gives ample evidence that environment is part of the story. But the evidence eventually may become unequivocal that genes are also part of the story. We are worried that the elite wisdom on this issue, for years almost hysterically in denial about that possibility, will snap too far in the other direction. It is possible to face all the facts on ethnic and race differences in intelligence and not run screaming from the room: That is the essential message.
This chapter is also central to the larger themes of the book, which is why we ask readers who have started with Part III to turn back to the Introduction and begin the long trek. In Part I, we described the formation of a cognitive elite. Given the cognitive differences among ethnic and racial groups, the cognitive elite cannot represent all groups equally, a statement with implications that we will develop in Part IV. In Part II, we described how intelligence is important for understanding the social problems of our time. We limited the discussion to whites to make it easier to think about the evidence without constantly having to worry about racism, cultural bias in the tests, or other extraneous issues.
The material in this chapter lets us proceed. As far as anyone has been able to determine, IQ scores on a properly administered test mean about the same thing for all ethnic groups. A substantial difference in cognitive ability distributions separates whites from blacks, and a smaller one separates East Asians from whites. These differences play out in public and private life. In the rest of Part III, we may now examine the relationship between social problems and IQ on a national scale.
Ethnic Inequalities in Relation to IQ
Ethnic differences in education, occupations, poverty, unemployment, illegitimacy, crime , and other signs of inequality preoccupy scholars and thoughtful citizens. In this chapter, we examine these differences after cognitive ability is taken into account.
We find that Latinos and whites of similar cognitive ability have similar social behavior and economic outcomes. Some differences remain, and a few are substantial, but the overall pattern is similarity. For blacks and whites, the story is more complicated. On two vital indicators of success—educational attainment and entry into prestigious occupations—the black-white discrepancy reverses. After controlling for IQ, larger numbers of blacks than whites graduate from college and enter the professions. On a third important indicator of success, wages, the black-white difference for year-round workers shrinks from several thousand to a few hundred dollars.
In contrast, the B/W gap in annual family income or in persons below the poverty line narrows after controlling for IQ but still remains sizable. Similarly, differences in unemployment, labor force participation, marriage, and illegitimacy get smaller but remain significant after extracting the effect of IQ. These inequalities must be explained by other factors in American life. Scholars have advanced many such explanations; we will not try to adjudicate among them here, except to suggest that in trying to understand the cultural, social, and economic sources of these differences, understanding how cognitive ability plays into the mix of factors seems indispensable. The role of cognitive ability has seldom been considered in the past. Doing so in future research could clarify issues and focus attention on the factors that are actually producing the more troubling inequalities.
A
merica’s pressing social problems are often portrayed in ethnic terms. Does the nation have an unemployment problem? It depends. Among whites in the recession year of 1992, unemployment was under seven percent, but it was fourteen percent among blacks.
1
Poverty? The poverty rate in 1992 for whites was less than twelve percent but thirty-three percent for blacks.
2
Such numbers, and the debate over what they should mean for policy, have been at the center of American social policy since the early 1960s. As Latinos have become a larger portion of the population, the debate has begun to include similar disparities between Latinos and whites.
Such disparities are indisputable. The question is why. Surely history plays a role. Open racism and institutional discrimination of less obvious sorts have been an important part of the historical story for blacks and are relevant to the historical experience of Latinos and Asian-Americans as well. Cultural differences may also be involved. An ethnic group with a strong Roman Catholic heritage, such as Latinos, may behave differently regarding birth control and illegitimacy than one without that background. The tradition of filial respect in the Confucian countries may bear on the behavior of American teenagers of East Asian ancestry when one looks at, for example, delinquency.
Part II showed the impact of cognitive ability on poverty, illegitimacy, crime, and other social problems in America among whites. Chapter 13 showed that the major ethnic groups in America differ, on the average, in cognitive ability. There is accordingly reason to ask what happens to ethnic differences in economic and social behavior when intelligence is held constant. This chapter examines that question.
The NLSY, with its large samples of blacks and Latinos (though not Asians), permits us to address the question directly and in detail. We will show what happens to the ethnic gap on a variety of indicators when IQ is taken into account. To anticipate: In some cases, large ethnic differences disappear altogether, or even reverse, with whites having the disadvantageous outcome compared to blacks and Latinos. In other cases, substantial differences remain, even after the groups are equated not only for cognitive ability but for parental SES and education as well. We do not try to press the analysis further, to find the other reasons why groups may differ socially. The goal of this chapter is to broaden the search for answers after three decades during which scholars have ignored the contribution of IQ to ethnic differences in the main social outcomes of everyday life.
First, we look at the indicators of success that were the focus of Part I, then the indicators of problems that were the focus of Part II.
We begin with what should be hailed as a great American success story. Ethnic differences in higher education, occupations, and wages are strikingly diminished after controlling for IQ. Often they vanish. In this sense, America has equalized these central indicators of social success.
The conventional view of ethnic differences in education holds that blacks and Latinos still lag far behind, based on comparisons of the percentage of minorities who finish high school, enter college, and earn college degrees. Consider, for example, graduation from high school. As of 1990, 84 percent of whites in the NLSY had gotten a high school diploma, compared to only 73 percent of blacks and 65 percent of Latinos, echoing national statistics.
3
But these percentages are based on everybody, at all levels of intelligence. What were the odds that a black or Latino with an IQ of 103—the average IQ of all high school graduates—completed high school? The answer is that a youngster from either minority group had a higher probability of graduating from high school than a white, if all of them had IQs of 103: The odds were 93 percent and 91 percent for blacks and Latinos respectively, compared to 89 percent for whites.
4
College has similarly opened up to blacks and Latinos. Once again, the raw differentials are large. In national statistics or in the NLSY sample, whites are more than twice as likely to earn college degrees than either blacks or Latinos.
5
The average IQ of all college graduates was, however, about 114. What were the odds that a black or Latino with an IQ of 114 graduated from college? The figure below shows the answers.
All the graphics in this chapter follow the pattern of this one. The top three bars show the probabilities of a particular outcome—college graduation in this case—by ethnic group in the NLSY, given the average age of the sample, which was 29 as of the 1990 interview. In this figure, the top three bars show that a white adult had a 27 percent chance of holding a bachelor’s degree, compared to the lower odds for blacks (11 percent) and Latinos (10 percent). The probabilities were computed through a logistic regression analysis.
After controlling for IQ, the probability of graduating from college is about the same for whites and Latinos, higher for blacks
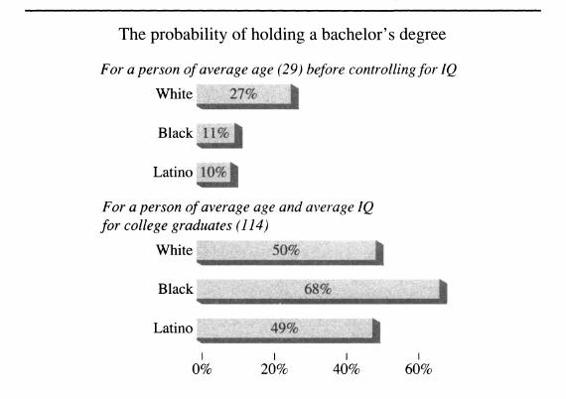
The lower set of bars also presents the probabilities by ethnic group, but with one big difference: Now, the equation used to compute the probability assumes that each of these young adults has a certain IQ level. In this case, the computation assumes that everybody has the average IQ of all college graduates in the NLSY—a little over 114. We find that a 29-year-old (in 1990) with an IQ of 114 had a 50 percent chance of having graduated from college if white, 68 percent if black, and 49 percent if Latino« After taking IQ into account, blacks have a better record of earning college degrees than either whites or Latinos. We discuss this black advantage in Chapter 19, when we turn to the effects of affirmative action.
One of the positive findings about ethnic differences has been that education pays off in occupational status for minorities roughly the same as it does for whites.
6
This was reflected in the NLSY as well: Holding education constant, similar proportions of blacks, Latinos, and whites are found in the various occupational categories.
7
To what extent does controlling for IQ produce the same result? We know from Chapter 2 that occupations draw from different segments of the cognitive ability distribution. Physicians come from the upper part of the distribution, unskilled laborers from the lower part, and so forth. If one ethnic group has a lower average IQ than another ethnic group, this will be reflected in their occupations, other things equal. What would the occupational distributions of different ethnic groups be after taking cognitive ability into account?
