The Price of Civilization: Reawakening American Virtue and Prosperity (29 page)
Read The Price of Civilization: Reawakening American Virtue and Prosperity Online
Authors: Jeffrey D. Sachs
Tags: #Business & Economics, #Economic Conditions, #History, #United States, #21st Century, #Social Science, #Poverty & Homelessness

Source: Data from Office of Management and Budget Historical Tables and author’s estimates.
There are three main sources of federal revenues. Roughly 8 percent or so of GDP in 2015 will come from personal income taxes, around 6.3 percent will come from payroll taxes for Social Security and Medicare, and 2.2 percent from the corporate tax. The rest, around 1.5 percent, will come from a variety of excise and other taxes.
To prepare a spending baseline for 2015, I divide the budget into six main categories. Under current law Social Security will account for around 5 percent of GDP. On current trends, health care spending (Medicare, Medicaid, and veterans’ health care) will account for around 6 percent. Other mandatory spending, such as unemployment insurance, disability pay, and the Earned Income Tax Credit, will account for another 2 percent. Military outlays will absorb 4 percent, and interest payments on the publicly held government debt will amount to around 3 percent. I assume that discretionary civilian spending will amount to around 4 percent of GDP, roughly the average of 2005–2008, before the crisis and the stimulus package. In total, therefore, a reasonable baseline for 2015 puts total spending at around 24 percent of GDP.
The single most important point about this accounting is the following: The budget baseline revenue of around 18 percent of GDP
will not even cover mandatory spending (13 percent) plus the military (4 percent) plus interest on the debt (3 percent).
This means that on the baseline, all civilian discretionary spending, and then some, would have to be paid for with borrowed money
.
It might be wondered how Clinton managed to balance the budget, and indeed run a small surplus, at the end of the 1990s. There were four parts to that. First, military spending fell to just 3 percent of GDP, compared with 5 percent today. That saved 2 percentage points of the budget, a good move that should be repeated. Second, revenues soared to around 20 percent of GDP on the back of a hot economy fueled by the temporary dot-com bubble and with top tax marginal rates slightly higher than today. Unfortunately we can count on tax revenues of only around 18 percent of GDP on the basis of the current tax system. Third, interest payments were only 2 percent of GDP in 2000 and will be close to 3 percent in 2015,
8
if not more. Fourth, mandatory programs accounted for only 10 percent of GDP and are likely to be around 13 percent by 2015. This sums to a shift of 6 percent of GDP toward deficit, even assuming that defense spending declines to 3 percent of GDP.
We must recall, too, that Clinton and the Republican-led Congress of that period deeply shortchanged key public expenditures—on education, infrastructure, energy, foreign assistance, poverty relief, R&D, and other areas. They squeezed spending below the levels needed to maintain U.S. competitiveness and social well-being in order to keep domestic spending at 15 percent of GDP. With our aging population, rising health care costs, and growing needs in infrastructure, education, energy, and other areas, domestic spending by 2015 will have to be far higher than 15 percent of GDP.
Deficit Cutting Beyond Illusions
Suppose that we want to close that deficit to zero or near zero (with the more precise target discussed below). We need to find budget
cuts plus tax increases that sum to around 6 percent of GDP. Most Americans say that they’d like to do this through spending cuts rather than tax increases. Budget cutting certainly sounds more appealing, as long as there is tremendous waste in the budget. The public indeed imagines that the civilian budget is laden with fat. The problem is that the public’s favorite targets for budget cutting are nowhere close enough to do the job. The notion of closing the deficit through budget cuts alone is a fantasy, though a popular one. Considerably higher revenues as a share of GDP will be needed.
Consider two of the politicians’ favorite targets for budget cuts: budget “earmarks” for pet projects within congressional districts (such as the famous “bridge to nowhere”) and foreign aid. Earmarks are on the order of $16 billion per year.
9
One percent of GDP is $150 billion per year. Hence earmarks account for 0.1 percent of GDP. Foreign assistance is approximately $30 billion per year, or 0.2 percent of GDP.
10
Combining the two categories, their complete elimination—warranted or not—would save just 0.3 percent of GDP, compared with a target of 5 to 6 percent in deficit cuts. So we’re at far less than a tenth of the solution, even with a draconian and unwise total elimination of foreign aid (which the public believes should be a larger fraction of the budget than now).
11
The mandatory programs represent additional potential targets for cutting waste, and at first glance much larger and meatier ones. Much of the public believes that the mandatory programs are one giant transfer machine, in which the deserving middle class is taxed in order to transfer income to the undeserving poor, especially to minorities who live on the public dole. In the 1980s, Reagan riffed repeatedly about “welfare queens” who allegedly stole from the public purse by collecting illegally on multiple welfare accounts. That image has stuck in the public mind. Let’s therefore take a closer look at the mandatory programs to see what might plausibly be cut.
As shown in
Figure 11.2
, the mandatory programs consist of universal programs such as Social Security and Medicare (for all elderly), social insurance programs such as unemployment compensation, and means-tested transfers for the poor such as food stamps.
12
The universal programs make up two-thirds of the mandatory spending, roughly 10 percent of GDP. There is relatively little political controversy over the outlays on those programs. The public strongly supports Social Security, Medicare, federal employee retirement and disability, and veterans’ benefits.
13
Any cuts in those programs would inevitably be very gradual and stretched out over decades. There are few if any short-term savings in this category, and with the aging of the population, we can expect an increase in such outlays by around 1 percent of GDP by 2020. Even Tea Party activists strongly support Medicare and Social Security by a wide margin.
Figure 11.2: Mandatory Spending as a Percentage of GDP for 2015
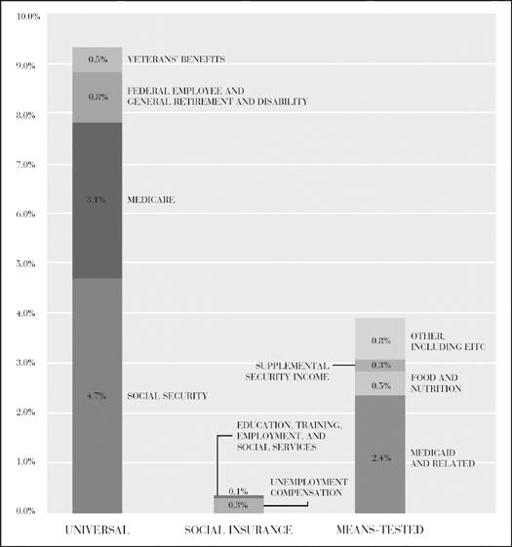
Source: Data from Office of Management and Budget Historical Tables.
The main category of social insurance is unemployment compensation. This program reached around 1.3 percent of GDP in 2010 because of the high unemployment rate in that year, but this will tend to revert to around 0.4 percent by 2015, assuming a gradual reduction of those qualifying for unemployment compensation. That cost saving is already taken into account in the baseline deficit in 2015 of 6 percent of GDP.
The means-tested category of spending is certainly the most contentious politically, the area where the public believes there is huge waste to trim.
14
The public believes that means-tested spending is mainly in the form of welfare payments for the (undeserving) poor. That is simply not true. Medicaid (health care for the poor) constitutes the largest of means-tested programs, 60 percent of the total and equal to around 2 percent of GDP. There is no broad public support for ending health care for the poor. Food stamps constitute the next largest program, roughly 0.5 percent of GDP. Here again, there is no public outcry to take food off the table of the poor. The third program is the Earned Income Tax Credit, which rebates taxes to poor working families. It is widely regarded as an important incentive to work for the poor. It constitutes around 0.3 percent of GDP.
Finally comes the welfare program that has been most contentious for decades: aid to poor families with dependent children. Welfare, formerly known as Aid to Families with Dependent Children, is now known as Temporary Assistance for Needy Families, or TANF.
This program makes up only 3.5 percent of the means-tested programs and just 0.1 percent of GDP
.
15
America cut back on “welfare” from the 1970s onward. Family income support fell from 0.4 percent of GDP in 1970 to under 0.2 percent in 2010.
16
Welfare still looms large in the public’s imagination, but it plays little role in the budget and
the deficit. It’s been a long time since America was generous to its poor families with children!
The upshot is that we could eliminate foreign aid, earmarks, and welfare payments in the TANF program entirely, and the combined effect would be to save just 0.5 percent of GDP out of a structural deficit of 5 to 6 percent of GDP. The hot-button items of the budget are a distraction from real budget balancing. Unless we are willing to slash Social Security, Medicare, Medicaid, veterans’ benefits, or food stamps to the bone, we have to look elsewhere to close the deficit.
What about waste, fraud, and abuse in civilian discretionary programs? Once again, there is much less than meets the eye. Civilian discretionary spending constitutes everything the government does aside from retirement, health care, social insurance, income support, and the military, yet the total is only around 4 percent of GDP. That modest level of spending is spread out over many areas, including general science, space science (NASA), health science, agriculture, commerce, transportation (including highways), environment (including water resources), energy, regional development, education, training, housing, the justice system (including the judiciary and penal system), public administration, international diplomacy, and international development assistance. Each of these areas of spending constitutes less than 1 percent of GDP. There are no areas of obvious massive waste. A few billion dollars of savings can surely be achieved by ending wasteful agriculture subsidies, but that would barely dent the overall budget deficit. Total spending on public administration—the much-derided “federal bureaucracy”—amounted to just $20 billion, or 0.13 percent of GDP, in fiscal year 2010.
17
When it comes to saving vast budgetary resources through cuts in waste, there is simply not vast waste to cut in civilian outlays.
Here is another way to show the falsity of the idea of vast waste hidden in the civilian budget. Obama established the National Commission on Fiscal Responsibility and Reform with a mandate to find
a path to budget balance. The commission was charged with identifying specific areas of budget cutting, yet it couldn’t find large waste to trim. Here is the list that the commission proposed and the estimated dollar savings for the year 2015, when GDP is expected to be $18.6 trillion:
18
- Reduce congressional and White House budgets, $800 million.
- Impose a three-year wage freeze on federal workers, $20 billion.
- Reduce the size of the federal workforce, $13 billion.
- Reduce federal travel, printing, and vehicle budgets, $1 billion.
- Sell excess federal real estate, $100 million.
- Eliminate all earmarks, $16 billion.
- Reform Medicare sustainable growth, $3 billion.
- Repeal support for long-term affordable care (the CLASS Act), $11 billion.
- Reduce Medicare fraud, $1 billion.
- Reform Medicare cost sharing, $10 billion.
- Restrict Medicare supplemental insurance, $4 billion.
- Extend Medicaid rebates to “dual eligibles,” $7 billion.
- Reduce excess payments to hospitals for medical education, $6 billion.
- Cut Medicare payments for bad debts, $3 billion.
- Accelerate savings for home health care providers, $2 billion.
- Medicaid savings, $6.3 billion.
- Medical malpractice reform, $2 billion.
- Reform health benefits for federal employees, $2 billion.
- Reduce agriculture spending, $1 billion.
- Eliminate in-school subsidies in student loan programs, $5 billion.
- Other specified saving, $1 billion.
This is a long list, to be sure, but it is not an impressive one in terms of budget savings as a percent of GDP. It sums to a mere $115 billion, or roughly 0.6 percent of GDP in 2015. And that’s an optimistic
assessment. Many of the supposed savings would not really materialize. Others may be ill advised, such as cutting support for long-term health care. The commission also called for other large savings by way of limiting cost-of-living adjustments and other gimmicks, rather than through specified cuts.
This is all pretty thin gruel. The supposition that there is massive waste to be cut in the civilian budget is simply a myth. To recapitulate: ending all earmarks and foreign aid and achieving all of the specific cuts on civilian programs proposed by the deficit commission, even if such choices were meritorious, would amount to less than 1 percent of GDP.