Wallach's Interpretation of Diagnostic Tests: Pathways to Arriving at a Clinical Diagnosis (4 page)
Authors: Mary A. Williamson Mt(ascp) Phd,L. Michael Snyder Md

Various salts of heparin, ethylenediaminetetraacetic acid (EDTA), and sodium citrate are used widely in the clinical laboratory. Heparin is the preferred anticoagulant for blood specimens for electrolyte levels and other routine chemistry tests. Obvious differences in the results of certain analytes between serum and heparinized plasma are related to the consumption of fibrinogen and the lysis of cellular elements during the process of clotting. EDTA is the commonly used anticoagulant for routine hematologic determinations. It functions as anticoagulant by chelating calcium ions, which are required for the clotting process. Citrate has been used as an anticoagulant for collection of blood specimens intended for global coagulation tests such as prothrombin time (PT) and partial thromboplastin time (PTT). A laboratory that has been using one of the concentrations (3.2% or 3.8%) to perform PT determination for patients receiving oral anticoagulant therapy should not interchange the formulations. Doing so will affect the international normalized ratios (INRs) that are used to report the results of PT. Sodium fluoride and lithium iodoacetate have been used alone or in combination with anticoagulants such as potassium oxalate, EDTA, citrate, or lithium heparin for blood collection. In the absence of glycolytic inhibitors, a decrease in the glucose level of as much as 24% can occur in 1 hour after blood collection in neonates, in contrast to a 5% decrease in healthy individuals when specimen is stored at room temperature. The anticoagulant-to-blood ratio is critical for some laboratory tests. In general, collecting of blood specimens to less than nominal volume increases the effective molarity of the anticoagulant and induces osmotic changes affecting cell morphologic features. Furthermore, the binding of analytes such as ionic calcium or magnesium to heparin can be enhanced when the effective concentration of unfractionated heparin increased beyond the normal 14.3 U/mL of blood. In addition, stability of various analytes are significantly reduced in plasma (Lithium Heparin) compared to serum tubes when plasma is stored, but not separated from the gel after centrifugation.
Virtually, all drugs may affect the results of clinical laboratory tests that includes both in vivo (pharmacologic) and in vitro (interferences and methodologic) effects. The problem of drug interference is complex, and physicians are generally aware of main therapeutic effects of drug, but many secondary effects are ignored. Some of the examples are increase in liver enzymes with Dilantin and barbiturates, increase in fibrinogen, transferrin, amylase, etc. following oral contraceptives and contrast agents (gadolinium) decreasing total calcium levels.
In coagulation, testing knowledge or access to the patient history may be necessary, as many medications such as anticoagulant therapies (warfarin, heparin, and direct thrombin inhibitors), blood product, and component transfusion and coagulation factor replacement therapies all impact coagulation test results. Over-the-counter drugs (aspirin) have prolonged effect on platelet function studies. In addition, the patient’s physiologic state plays a role.
The quality of the specimens submitted to the microbiology laboratory is critical for optimal specimen evaluation. The general techniques of specimen collection and handling that have been established both to maximize the yield of organisms and isolate relevant pathogens from specimens obtained from different body sites should be reviewed with clinical laboratory prior to obtaining the specimen. In addition, valid interpretation of the results of culture can be achieved only if the specimen obtained is appropriate for processing. As a result, care must be taken to collect only those specimens that may yield pathogens, rather than colonizing flora or contaminants. Specific rules for the collection of material vary, depending on the source of the specimen, but several general principles apply. Prompt transport of specimens to the microbiology laboratory is essential to optimize the yield of cultures and the interpretation of results. Delays in processing may result in the overgrowth of some microorganisms or the death of more fastidious ones. Samples for bacterial culture should ideally arrive in the microbiology laboratory within 1 to 2 hours of collection. If a delay is unavoidable, most specimens (with the exception of blood, cerebrospinal fluid, joint fluid, and cultures for
Neisseria gonorrhoeae
) should be refrigerated until transported.
ANALYTIC ERRORS
Clinical laboratories have long focused their attention on quality control methods and quality assessment programs dealing with analytic aspects of testing. Total analytic error (or measurement error) refers to assay errors from all sources arising from the data collection experiment. Some error is expected, because not all components of measuring are the same. There are four major types of experimental error: random (not predictable), systematic (one direction), total (random and systematic), and idiosyncratic (nonmethodologic).
Errors due to analytic problems have been significantly reduced over time, but there is evidence that, particularly for immunoassays, interference may have a serious impact on patients. Paraproteins can interfere in chemical measurements when they form precipitates during the testing procedure. Heterophilic antibodies are human antibodies that can bind animal antibodies. They can cause problems in immunoassays, particularly immunometric assays, where they can form a bridge between the capture and detection antibodies, leading to false-positive results in the absence of analyte or if analyte is also present, a false increase in measured concentrations. Very rarely, heterophilic antibodies can also lead to false-negative or falsely low results.
Very high hormone levels can interfere with immunoassay systems, resulting in falsely low analyte determinations. This is attributable to the “hook effect,” which describes the inhibition of immune complex formation by excess antigen concentration. There are proteins that are well known to form aggregates with immunoglobulins or high molecular weight proteins. Clinically relevant proteins that can have “macro” forms—including amylase, creatinine kinase, LDH, and prolactin—can elevate the results when using certain laboratory tests, yet the patient lacks clinical disease related to elevated analyte concentration.
Immunoassay interference is
not
analyte specific and is variable with respect to time. In some patients, this interference can lost for a long time and in some for only a short time. This interference affects lots of assays but not all of them. In addition, a different manufacturer’s test kits have different cross-reactions with interference compounds, and the test results vary from lab to lab.
Incorrect results can also occur as a result of a large number of biologically common phenomena causing analytic variation. These include cold agglutinins, rouleaux, osmotic matrix effects, platelet agglutination, giant platelets, unlysed erythrocytes, nucleated erythrocytes, megakaryocytes, red cell inclusions, cryoproteins, circulating mucin, leukocytosis, in vitro hemolysis, extreme microcytosis, bilirubinemia, lipemia, and so on.
DIAGNOSTIC TEST VALUES
Before a method is used routinely, method evaluation protocols must ensure that the measurement procedure meets defined criteria, for example, the accuracy, precision, and stability required in meeting the laboratory’s patient population needs. Four indicators are most commonly used to determine the reliability of a clinical laboratory test. Two of these, accuracy and precision, reflect how well the test method performs day to day in a laboratory. The other two, sensitivity and specificity, deal with how well the test is able to distinguish disease from the absence of disease.
The accuracy and precision of each test method are established and are frequently monitored by the clinical laboratory. Sensitivity and specificity data are determined by research studies and clinical trials. Although each test has its own performance measures and appropriate uses, laboratory tests are designed to be as precise, accurate, specific, and sensitive as possible.
ACCURACY AND PRECISION
“
Accuracy
” (
trueness
) refers to the ability of the test to actually measure what it claims to measure and is defined as the proportion of all test results (both positive and negative) that are correct.
Precision
(
repeatability
) refers to the ability of the test to reproduce the same result when repeated on the same patient or sample. The two concepts are related, but different. For example, a test could be precise but not accurate if on three occasions it produced roughly the same result but that result differed greatly from the actual value determined by a reference standard.
Sensitivity
is defined as the ability of the test to identify correctly those who have the disease. It is the number of subjects with a positive test who have the disease divided by all subjects who have the disease. A test with high sensitivity has few false-negative results.
Specificity
is defined as the ability of the test to identify correctly those who do not have the disease. It is the number of subjects who have a negative test and do not have the disease divided by all subjects who do not have the disease. A test with high specificity has few false-positive results. Sensitivity and specificity are most useful when assessing a test used to screen a free-living population. These test characteristics are also interdependent (Figure
1-1
): an increase in sensitivity is accompanied by a decrease in specificity and vice versa.
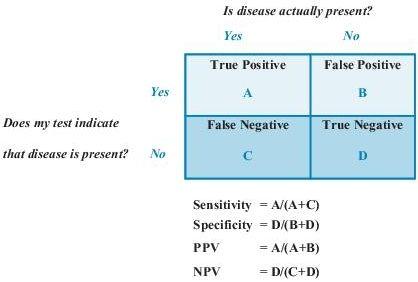
Figure 1–1
Sensitivity, specificity, and predictive values in laboratory testing. NPV, negative predictive value; PPV, positive predictive value.
Predictive values
are important for assessing how useful a test will be in the clinical setting at the individual patient level. The
positive predictive value
(PPV) is the probability of disease in a patient with a positive test. Conversely, the
negative predictive value
(NPV) is the probability that the patient does not have disease if he has a negative test result.
PPV and sensitivity of tests are complementary in their examination of true positives. Given that the test is positive, PPV is the probability that the disease is present, in contrast to sensitivity, which is given that the disease is present, the probability that test is positive. Likewise, NPV and specificity are complementary in their examination of true negatives. Given that the test is negative, NPV is the probability that the disease is absent. This is in contrast to specificity, which is given that the disease is absent, the probability that test is negative (see Figure
1-1
for more information). Predictive values depend on the prevalence of a disease in a population. A test with a given sensitivity and specificity can have different predictive values in different patient populations. If the test is used in a population with high disease prevalence, it will have a high PPV; the same test will have a low PPV when used in a population with low disease prevalence.
Likelihood ratios
(LRs) are another way of assessing the accuracy of a test in the clinical setting. They are also independent of disease prevalence. LR indicates how much a given diagnostic test result will raise or lower the odds of having a disease relative to the probability of the disease. Each test is characterized by two LRs: positive LR (PLR) and negative LR (NLR). PLR tells us the odds of the disease if the test result is positive, and NLR tells the odds of disease if the test result is negative.
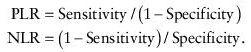
An LR >1 increases the odds that the person has the target disease, and the higher the LR, the greater this increase in odds. Conversely, an LR ratio <1 diminishes the odds that the patient has the target disease.
RECEIVER OPERATING CHARACTERISTIC (ROC) CURVES
ROC curves allow one to identify the cutoff value that minimizes both false positives and false negatives. An ROC curve plots sensitivity on the y axis and 1 − specificity on the x axis. Applying a variety of cutoff values to the same reference population allows one to generate the curve. The perfect test would have a cutoff value that allowed an exact split of diseased and nondiseased populations (i.e., a cutoff that gave both 100% sensitivity and 100% specificity). It would plot as a right angle with the fulcrum in the far upper left corner (x = 0, y = 1). This case, however, is very rare. For most cases, as one moves from the left to right on the ROC curve, the sensitivity increases and the specificity decreases.