Bailout Nation (16 page)
Authors: Barry Ritholtz

With the U.S. economy under the weather, the government prescribed the usual medicine: big tax cuts in 2001, lots of deficit spending, increased money supply, military spending for two wars, and significant interest rate cuts. This tried-and-true treatment is usually effective in jump-starting economic growth. Some theorists argue that left alone, any economy subjected to a run of the mill recession would eventually self-correct anyway, but that's a discussion best saved for another day.
Figure 8.1
Real Gross Domestic Product
Real Gross Domestic Product
SOURCE: U.S. Bureau of Economic Analysis

A funny thing happened on the way to the recovery:
Nothing
. Despite the massive stimulus, the economy failed to respond. Following the Tax Relief Act of 2001, plenty of deficit spending in 2002, lower rates (and even more tax cuts in 2003), the economy was barely limping along. Real gross domestic product (GDP) was nearly flat in Q4 of 2002 (see
Figure 8.1
). The possibility of a double-dip recession was real, and that was making the Federal Reserve very nervous.
In the aftermath of the 2000-2001 recession, nonfarm payroll growth was anemic. With the exception of only one quarter (Q4 2006) real (i.e., after-inflation) wage growth was flat or negative. As of the third quarter of 2006, there were only 3.5 percent more jobs than there had been at the end of the recession. This compares very unfavorably with prior recoveries.
Consider the 1953-1954 period, which was followed by the worst of the nine recession recoveries since World War II. Yet even that recovery period had job gains more than double the current cycle: Following the 1953-1954 recession, total employment gained 7.6 percent over the ensuing five years. Even more astounding, that relatively poor showing was actually held down by the recession of 1957-1958.
To put this into context, five years after each of the previous nine recessions, “there were an average of 11.9 percent more jobs in the economy than there had been at the end of the recession.”
1
1
New job creation during the 2002-2007 recovery cycle was the worst on record since World War II. And income fared no better: Wage gains failed to even keep up with inflation for most of this period even as home prices and asset prices soared.
The Federal Open Market Committee (FOMC) had watched Japan get caught in a decade-long recession, compounded by a nasty case of deflation. After Japan's own real estate and stock bubbles burst in 1989, consumers there had become increasingly cautious. While the Japanese are culturally much more likely to save than Americans are, they had taken frugality to new extremes. And the less the Japanese spent, the more manufacturers and retailers slashed prices, hoping to draw them back to a consumptive mood. The longer consumers waited, the cheaper goods got. This vicious deflationary cycle, once started, is difficult to break.
On November 21, 2002, then Fed Governor Ben Bernanke gave a speech entitled “Deflation: Making Sure âIt' Doesn't Happen Here.” Bernanke made reference to the government's not-so-secret antideflation weapon:
The U.S. government has a technology, called a printing press (or, today, its electronic equivalent), that allows it to produce as many U.S. dollars as it wishes at essentially no cost. By increasing the number of U.S. dollars in circulation, or even by credibly threatening to do so, the U.S. government can also reduce the value of a dollar in terms of goods and services, which is equivalent to raising the prices in dollars of those goods and services. We conclude that, under a paper-money system, a determined government can always generate higher spending and hence positive inflation.
2
2
That antideflation speech turned out to be quite prophetic: Bernanke eventually became Fed chair, and he put those printing presses to good use. Bond desks would nickname him “Helicopter Ben,” thanks to his speech that threatened a metaphorical money drop as a way to stave off deflation.
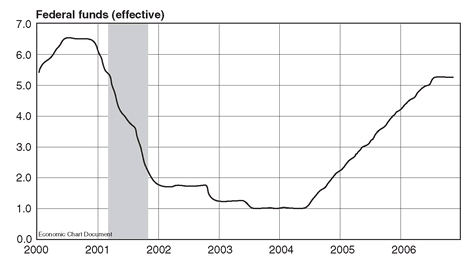
Figure 8.2
Federal Fund Rates, 2000-2006
Federal Fund Rates, 2000-2006
SOURCE: Economagic

But that nickname was still off in the future. Circa 2001, the Federal Reserve was getting increasingly nervous. Under the leadership of then Chair Alan Greenspan, the Fed began the most significant rate-cutting cycle in its history (see
Figure 8.2
). From precrash highs of 6.5 percent, the Fed took rates all the way down to 1.75 percent. As discussed in Chapter 7, the Greenspan Fed maintained a 1.75 percent federal funds rate for 33 months (December 2001 to September 2004), a 1.25 percent rate for 21 months (November 2002 to August 2004), and last, a 1 percent fed funds rate for over 12 months (June 2003 to June 2004). While the fed funds rate had been as low as 1 percent some 46 years earlier, it had never been allowed to stay that low for more than a year! This was simply unprecedented.
Money is often described as “cheap” or “expensive,” depending on how costly it is to borrow. This money wasn't cheapâit was
ultra-
cheap. That fueled the housing fire, sending prices skyward.
ultra-
cheap. That fueled the housing fire, sending prices skyward.
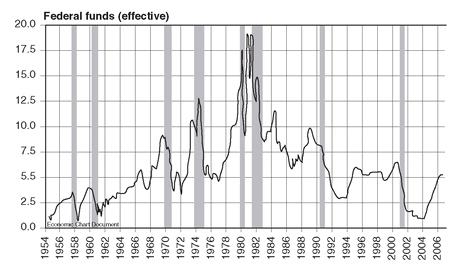
As
Figure 8.3
shows, this degree of stimulusâand for such an extended periodâhad never occurred before.
Figure 8.3
shows, this degree of stimulusâand for such an extended periodâhad never occurred before.
The global reaction was a boom in dollar-denominated assets. Consumers responded with a new round of cheap debt-funded spending. Residential real estate prices soared, and automobile sales spiked. Industrial metals reached all-time highs. And corporate profitability, as a percentage of GDP, reached never-before-seen heights. All thanks to the Fed's easy money prescription.
The Maestro had apparently done it again. Greenspan turned a market collapse into a full-blown recovery. If the tech boom and crash were caused by low rates and easy money, then a hair of the dog that bit you was just the hangover cure for the economy.
Or so it seemed.
Figure 8.3
Federal Fund Rates, 1954-2006
Federal Fund Rates, 1954-2006
SOURCE: Economagic

Beneath the surface, the economy was much less rosy than it appeared. Inflation was starting to heat up. Commodity prices exploded, and oil broke out to record highs. That old inflation standby, gold, reached levels not seen in decades. At the same time, salaries remained flat, and compensation as a percentage of GDP dropped to multidecade lows. This was very unusual for the recovery period following a recession. It was not typically seen in healthy economies.
Also anomalous was the housing boom's outsized impact on jobs. According to a 2005 study by Asha Bangalore of Northern Trust Company, 43 percent of all new job creation between November 2001 and April 2005 was real estate related:
Residential investment outlays have made a sizable contribution to the growth of real GDP in the current business expansion and sales of new and existing homes have soared to set new records. The future of the housing market is tied to employment conditions in the economy. The sluggish performance of payroll employment is the primary reason for the FOMC to take a measured path toward bringing the federal funds rate to a neutral level. At the same time, the performance of the housing market has played a visible role in payroll growth. Employment in housing and related industries (sum of employment in the establishment survey under various categories related to housing industry) accounted for about 43.0% of the increase in private sector payrolls since the economic recovery began in November 2001.
3
3
The housing boom was creating jobs for builders, contractors, real estate agents, mortgage brokers, and even employees at Home Depot and Lowe's. But the most significant impact to the economy came from home equity lines of credit (HELOCs) and cash-out mortgage refinancings. With wages stagnant, Americans turned to home equity withdrawals in order to maintain their standard of living.
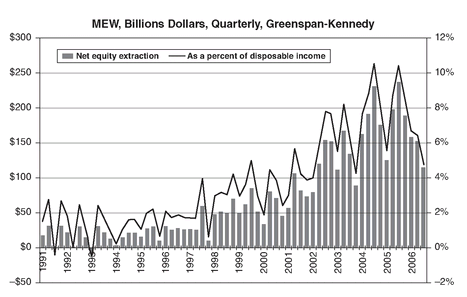
This was one of the single biggest and most unexpected elements of the debt-driven economic expansion. Outside of real estate, employment gains were modest and real wage gains flat. It was debt that drove the increase in consumer spending. Mortgage equity withdrawals (MEWs)ânormally a small portion of consumer debtâexploded. The accelerating borrowing against their homes allowed consumers to keep on spending, even as their savings rate went negative for the first time since the 1930s.
Without this home equity-based consumption, the nation would have been in recession territory, with GDP flat to 1 percent. At least, according to an unofficial Fed study by none other than Alan Greenspan (see
Figures 8.4
and
8.5
).
Figures 8.4
and
8.5
).
Since rates hit their lows in 2003, the impact of mortgage equity withdrawal has been nothing short of breathtaking: MEW was responsible for more than 75 percent of GDP growth from 2003 to 2006.
It's helpful to consider what MEW had been like in the past: For most of the 1990s, the net equity pulled out by homeownersâeither through sales or through home equity refinancingâwas fairly modest: about $25 billion per quarter, or about 1 percent of disposable personal income.
The impact of MEW began to accelerate once the Fed cut rates so spectacularly. By mid-2002, the quarterly average MEW was north of $100 billion, up nearly 400 percent since 1997 and greater than 4 percent of disposable income. By 2003, those quarterly numbers were $150 billion and 6 percent.
Then, things exploded: MEW hit a peak in 2004, as quarterly withdrawals were almost a quarter of a trillion dollarsâover 10 percent of disposable personal income. To put that into context, that was a 1,000 percent gain in the 10 years since 1995.
In addition to the actual dollars extracted from housing, the psychological impact that feeling financially flush has on spending cannot be underestimated. The wealth effect, as it is known, shows that every $100 gain in a stock portfolio creates $4 in additional consumer spending. But this wealth effect is even more significant for homes. A recent study found that an increase in owned housing value of $100 will boost spending by $9âmore than twice the impact on spending of stock market wealth effect gains.
4
4
Considering how widespread home ownership is in the United States, this is quite significant: About 68.5 percent of American families live in their own homes (it was as high as 70 percent recently). While ownership of stocks is widespreadâstudies put market participation at near 50 percent of all Americansâthe typical family has a rather small percentage of their net worth in equities. Indeed, in most cases, stocks are their second- or third-largest asset. For the vast majority of Americans, their home is their largest asset.
Figure 8.4
Mortgage Equity Withdrawal, Net Extraction, and Percentage of Disposable Personal Income
Mortgage Equity Withdrawal, Net Extraction, and Percentage of Disposable Personal Income
SOURCE: Calculated Risk,
www.calculatedriskblog.com
www.calculatedriskblog.com

Other books
PrimevalPassion by Cyna Kade
Brittany Bends by Grayson, Kristine
Flashback by Simon Rose
Ghosts in the Attic by Gunnells, Mark Allan
Trouble When You Walked In (Contemporary Romance) by Kieran Kramer
A Viking For The Viscountess by Michelle Willingham
B004YENES8 EBOK by Rosenzweig, Barney
A Bride for Keeps by Melissa Jagears
Caught in the Surf by Jasinda Wilder
