Read How to Read a Paper: The Basics of Evidence-Based Medicine Online
Authors: Trisha Greenhalgh
How to Read a Paper: The Basics of Evidence-Based Medicine (12 page)

What outcome was measured, and how?
If you had an incurable disease, for which a pharmaceutical company claimed to have produced a new wonder drug, you would measure the efficacy of the drug in terms of whether it made you live longer (and, perhaps, whether life was
worth
living given your condition and any side effects of the medication). You would not be too interested in the levels of some obscure enzyme in your blood that the manufacturer assured you were a reliable indicator of your chances of survival. The use of such
surrogate endpoints
is discussed further in the section ‘Surrogate endpoints’ on page 81.
Table 4.1
Examples of problematic descriptions in the methods section of a paper
| What the authors said | What they should have said (or should have done) | An example of |
| ‘We measured how often GPs ask patients whether they smoke.’ | ‘We looked in patients’ medical records and counted how many had had their smoking status recorded.' | Assumption that medical records are 100% accurate. |
| ‘We measured how doctors treat low back pain.’ | ‘We measured what doctors say they do when faced with a patient with low back pain.’ | Assumption that what doctors say they do reflects what they actually do. |
| ‘We compared a nicotine-replacement patch with placebo.’ | ‘Participants in the intervention group were asked to apply a patch containing 15 mg nicotine twice daily; those in the control group received identical-looking patches.’ | Failure to state dose of drug or nature of placebo. |
| ‘We asked 100 teenagers to participate in our survey of sexual attitudes.’ | ‘We approached 147 white American teenagers aged 12–18 (85 males) at a summer camp; 100 of them (31 males) agreed to participate.’ | Failure to give sufficient information about participants. (Note in this example the figures indicate a recruitment bias towards women.) |
| ‘We randomised patients to either “individual care plan” or “usual care.”’ | ‘The intervention group were offered an individual care plan consisting of .............; control patients were offered ................’. | Failure to give sufficient information about intervention. (Enough information should be given to allow the study to be repeated by other workers.) |
| ‘To assess the value of an educational leaflet, we gave the intervention group a leaflet and a telephone helpline number. Controls received neither.’ | If the study is purely to assess the value of the leaflet, both groups should have got the helpline number. | Failure to treat groups equally apart from the specific intervention. |
| ‘We measured the use of vitamin C in the prevention of the common cold.’ | A systematic literature search would have found numerous previous studies on this subject (see When is a review systematic? section). | Unoriginal study. |
The measurement of symptomatic (e.g. pain), functional (e.g. mobility), psychological (e.g. anxiety) or social (e.g. inconvenience) effects of an intervention is fraught with even more problems. The methodology of developing, administering and interpreting such ‘soft’ outcome measures is beyond the scope of this book. But, in general, you should always look for evidence in the paper that the outcome measure has been objectively validated—that is, that someone has demonstrated that the ‘outcome measure’ used in the study has been shown to measure what it purports to measure, and that changes in this outcome measure adequately reflect changes in the status of the patient. Remember that what is important in the eyes of the doctor may not be valued so highly by the patient, and vice versa. One of the most exciting developments in evidence based medicine (EBM) in recent years is the emerging science of patient-reported outcomes measures, which I cover in the section ‘PROMs’ on page 223.
Was systematic bias avoided or minimised?
Systematic bias
is defined by epidemiologists as anything that erroneously influences the conclusions about groups and distorts comparisons [4]. Whether the design of a study is an randomised control trial (RCT), a non-randomised comparative trial, a cohort study or a case–control study, the aim should be for the groups being compared to be as like one another as possible except for the particular difference being examined. They should, as far as possible, receive the same explanations, have the same contacts with health professionals, and be assessed the same number of times by the same assessors, using the same outcome measures [5] [6]. Different study designs call for different steps to reduce systematic bias.
Randomised controlled trials
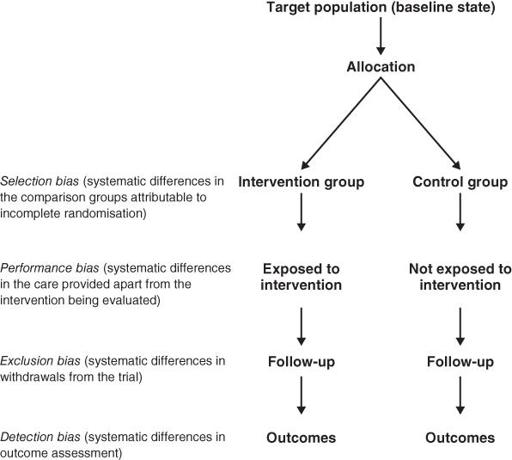
In an RCT, systematic bias is (in theory) avoided by selecting a sample of participants from a particular population and allocating them randomly to the different groups. Section ‘Randomised controlled trials’ describes some ways in which bias can creep into even this gold standard of clinical trial design, and
Figure 4.1
summarises particular sources to check for.
Figure 4.1
Sources of bias to check for in a randomised controlled trial.
Non-randomised controlled clinical trials
I once chaired a seminar in which a multidisciplinary group of students from the medical, nursing, pharmacy and allied professions were presenting the results of several in-house research studies. All but one of the studies presented were of comparative, but non-randomised, design—that is, one group of patients (say, hospital outpatients with asthma) had received one intervention (say, an educational leaflet), while another group (say, patients attending general practitioner (GP) surgeries with asthma) had received another intervention (say, group educational sessions). I was surprised how many of the presenters believed that their study was, or was equivalent to, an RCT. In other words, these commendably enthusiastic and committed young researchers were blind to the most obvious bias of all: they were comparing two groups that had inherent, self-selected differences even before the intervention was applied (as well as having all the additional potential sources of bias listed in
Figure 4.1
for RCTs).
As a general rule, if the paper you are looking at is a non-randomised controlled clinical trial, you must use your common sense to decide if the baseline differences between the intervention and control groups are likely to have been so great as to invalidate any differences ascribed to the effects of the intervention. This is, in fact, almost always the case [7]. Sometimes, the authors of such a paper will list the important features of each group (such as mean age, sex ratio and markers of disease severity) in a table to allow you to compare these differences yourself.
Cohort studies
The selection of a comparable control group is one of the most difficult decisions facing the authors of an observational (cohort or case–control) study. Few, if any, cohort studies, for example, succeed in identifying two groups of subjects who are equal in age, gender mix, socioeconomic status, presence of coexisting illness and so on, with the single difference being their exposure to the agent being studied. In practice, much of the ‘controlling’ in cohort studies occurs at the analysis stage, where complex statistical adjustment is made for baseline differences in key variables. Unless this is performed adequately, statistical tests of probability and confidence intervals (see section ‘Probability and confidence’) will be dangerously misleading [6] [7].
This problem is illustrated by the various cohort studies on the risks and benefits of alcohol, which have consistently demonstrated a J-shaped relationship between alcohol intake and mortality. The best outcome (in terms of premature death) lies with the cohort group who are moderate drinkers [8]. Self-confessed teetotalers, it seems, are significantly more likely to die young than the average person who drinks three or four drinks a day.
But can we assume that teetotallers are,
on average
, identical to moderate drinkers except for the amount they drink? We certainly can't. As we all know, the teetotal population includes those who have been ordered to give up alcohol on health grounds (‘sick quitters’), those who, for health or other reasons, have cut out a host of additional items from their diet and lifestyle, those from certain religious or ethnic groups which would be under-represented in the other cohorts (notably Muslims and Seventh Day Adventists), and those who drink like fish but choose to lie about it.
The details of how these different features of teetotalism were controlled for by the epidemiologists are discussed elsewhere [8] [9]. Interestingly, when I was writing the third edition of this book in 2005, the conclusion at that time was that even when due allowance was made in the analysis for potential confounding variables in people who described themselves as non-drinkers, these individuals' increased risk of premature mortality remained (i.e. the J curve was a genuine phenomenon) [8].
But by the time I wrote the fourth edition in 2010, a more sophisticated analysis of the various cohort studies (i.e. which controlled more carefully for ‘sick quitters’) had been published [9]. It showed that, all other things being equal, teetotallers are no more likely to contract heart disease than moderate drinkers (hence, the famous ‘J curve’ may have been an artefact all along). Subsequently, a new meta-analysis purported to show that the J curve was a genuine phenomenon and alcohol was indeed protective in small quantities [10]—but a year later a new analysis of the same primary studies came to the opposite conclusion, having placed more weight on so-called methodological flaws [11]. Depending on your perspective, this could be one to discuss with your EBM colleagues over a beer.
Case–control studies
In case–control studies (in which, as I explained in section ‘Case reports’, the experiences of individuals with and without a particular disease are analysed retrospectively to identify exposure to possible causes of that disease), the process most open to bias is not the assessment of outcome, but the diagnosis of ‘caseness’ and the decision as to
when
the individual became a case.
A good example of this occurred a few years ago when legal action was brought against the manufacturers of the whooping cough (pertussis) vaccine, which was alleged to have caused neurological damage in a number of infants [12]. In order to answer the question ‘Did the vaccine cause brain damage?’, a case–control study had been undertaken in which a ‘case’ was defined as an infant who, previously well, had exhibited fits or other signs suggestive of brain damage within 1 week of receiving the vaccine. A control was an infant of the same age and sex taken from the same immunisation register, who had received immunisation and who may or may not have developed symptoms at some stage.
New onset of features of brain damage in apparently normal babies is extremely rare, but it does happen, and the link with recent immunisation could conceivably be coincidental. Furthermore, heightened public anxiety about the issue could have biased the recall of parents and health professionals so that infants whose neurological symptoms predated, or occurred some time after, the administration of pertussis vaccine, might be wrongly classified as cases. The judge in the court case ruled that misclassification of three such infants as ‘cases’ rather than controls led to the overestimation of the harm attributable to whooping cough vaccine by a factor of three [12]. Although this ruling has subsequently been challenged, the principle stands—that assignment of ‘caseness’ in a case–control study must be performed rigorously and objectively if systematic bias is to be avoided.
Was assessment ‘blind’?
Even the most rigorous attempt to achieve a comparable control group will be wasted effort if the people who assess outcome (e.g. those who judge whether someone is still clinically in heart failure, or who say whether an X-ray is ‘improved’ from last time) know which group the patient they are assessing was allocated to. If you believe that the evaluation of clinical signs and the interpretation of diagnostic tests such as ECGs and X-rays is 100% objective, you haven't been in the game very long [13].
