Rise of the Robots: Technology and the Threat of a Jobless Future (7 page)
Read Rise of the Robots: Technology and the Threat of a Jobless Future Online
Authors: Martin Ford

Four months after the Johnson administration received the Triple Revolution report, the president signed a bill creating the National Commission on Technology, Automation, and Economic Progress.
7
In his remarks at the bill’s signing ceremony, Johnson said that “automation can be the ally of our prosperity if we will just
look ahead, if we will understand what is to come, and if we will set our course wisely after proper planning for the future.” The newly formed commission then—as is almost universally the case with such commissions—quickly faded into obscurity, leaving behind at least three book-length reports of its own.
8
The irony of all the automation worries in the postwar period was that the economy offered very little in the way of evidence to support such concerns. When the Triple Revolution report was released in 1964, the unemployment rate was just over 5 percent, and it would fall to a low of 3.5 percent by 1969. Even during the four recessions that occurred between 1948 and 1969, unemployment never reached 7 percent, and then it fell rapidly once recovery was under way.
9
The introduction of new technologies did drive substantial increases in productivity, but the lion’s share of that growth was captured by workers in the form of higher wages.
By the early 1970s, focus had shifted to the OPEC oil embargo, and then to the subsequent years of stagflation. The potential for machines and computers to cause unemployment was pushed further and further out of the mainstream. Among professional economists in particular, the idea became virtually untouchable. Those who did dare to entertain such thoughts risked being labeled a “neo-Luddite.”
Given that the dire circumstances predicted by the Triple Revolution report did not come to pass, we can ask an obvious question: Were the authors of the report definitively wrong? Or did they—like many others before them—simply sound the alarm far too soon?
Norbert Wiener, as one of the early pioneers of information technology, perceived the digital computer as being fundamentally different from the mechanical technologies that preceded it. It was a game changer: a new kind of machine with the potential to usher in a new age—and, ultimately, perhaps rend the very fabric of society. Yet, Wiener’s views were expressed at a time when computers were room-sized monstrosities whose calculations were powered by tens of thousands of searingly hot radio vacuum tubes, some number of
which could be expected to fail on a near daily basis.
10
It would be decades before the exponential arc of progress would drive digital technology to a level where such views might reasonably be justified.
Those decades are now behind us, and the time is ripe for an open-minded reassessment of the impact of technology on the economy. The data shows that even as concerns about the impact of labor-saving technology receded to the fringes of economic thought, something that had been fundamental to the postwar era of prosperity gradually began to change in the American economy. The nearly perfect historical correlation between increasing productivity and rising incomes broke down: wages for most Americans stagnated and, for many workers, even declined; income inequality soared to levels not seen since the eve of the 1929 stock market crash; and a new phrase—“jobless recovery”—found a prominent place in our vocabulary. In all, we can enumerate at least seven economic trends that, taken together, suggest a transformative role for advancing information technology.
Seven Deadly Trends
Stagnant Wages
The year 1973 was an eventful one in the history of the United States. The Nixon administration was embroiled in the Watergate scandal, and in October, OPEC initiated an oil embargo that would soon result in long lines of angry motorists at gas stations across the country. Even as Nixon descended into his death spiral, however, there was another story unfolding. This story began with an event that went completely unheralded and yet marked the beginning of a trend that would arguably dwarf both Watergate and the oil crisis in importance. For that was the year a typical American worker’s pay reached its peak. Measured in 2013 dollars, a typical worker—that is, production and nonsupervisory workers in the private sector, representing well over half the American workforce—earned about $767 per week in
1973. The following year, real average wages began a precipitous decline from which they would never fully recover. A full four decades later, a similar worker earns just $664, a decline of about 13 percent.
11
The story is modestly better if we look at median household incomes. Between 1949 and 1973, US median household incomes roughly doubled, from about $25,000 to $50,000. Growth in median incomes during this period tracked nearly perfectly with per capita GDP. Three decades later, median household income had increased to about $61,000, an increase of just 22 percent. That growth, however, was driven largely by the entry of women into the workforce. If incomes had moved in lockstep with economic growth—as was the case prior to 1973—the median household would today be earning well in excess of $90,000, over 50 percent more than the $61,000 they do earn.
12
Figure 2.1
shows the relationship between labor productivity
*
(which measures the value of workers’ hourly output) and compensation (which includes wages and benefits) paid to ordinary private sector workers from 1948 onward. The first segment of the graph (from 1948 to 1973) shows the way economists expect things to work. Growth in productivity moves in almost perfect lockstep with compensation. Prosperity marches upward and is shared broadly by all those who contribute to the economy. Beyond the mid-1970s, the widening gap between the two lines is a graphic illustration of the extent to which the fruits of innovation throughout the economy are now accruing almost entirely to business owners and investors, rather than to workers.
Figure 2.1. Growth of Real Hourly Compensation for Production and Nonsupervisory Workers Versus Productivity (1948–2011)

S
OURCE
: Lawrence Mishel, Economic Policy Institute, based on an analysis of unpublished total economy data from the Bureau of Labor Statistics, the Labor Productivity and Costs program, and the Bureau of Economic Analysis’s National Income and Product Accounts public data series.
13
Despite the clarity of this graph, many economists have still not fully acknowledged the divergence between wage and productivity growth.
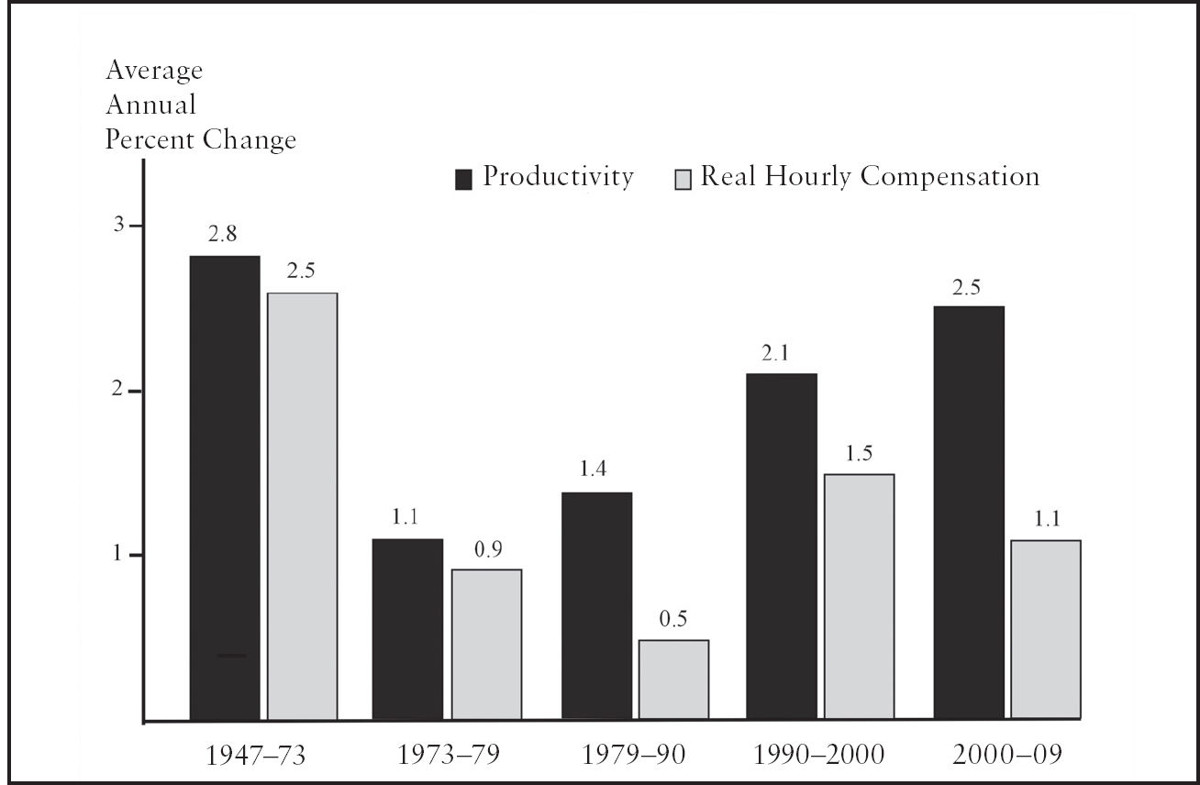
Figure 2.2
shows how growth rates for compensation and productivity compare during different periods going back to 1947. Productivity has significantly outstripped compensation in every decade from 1980 on. The difference is especially dramatic from 2000 to 2009; although productivity growth nearly matches the 1947–1973 period—the golden era of postwar prosperity—compensation lags far behind. It’s difficult to look at this graph and not come away with the impression that productivity growth is pretty clearly blowing the doors off the raises that most workers are getting.
The authors of most college economics textbooks have been especially slow to acknowledge this picture. Consider, for example,
Principles of Economics,
an introductory textbook authored by John B. Taylor and Akila Weerapana,
15
the required text for Professor Taylor’s wildly popular introductory economics class at Stanford University. It includes a bar chart very similar to
Figure 2.2
, but still argues for a tight relationship between wages and productivity. What about the fact that productivity leaps away from wages beginning in the 1980s? Taylor and Weerapana note that “the relationship is not perfect.” That appears to be something of an understatement. The 2007 edition of another textbook, also titled
Principles of Economics
16
and co-authored by Princeton professor—and former Federal Reserve chairman—Ben Bernanke, suggests that slow wage growth from 2000 on may have resulted from “the weak labor market that followed the recession of 2001” and that wages ought to “catch up to productivity growth as the labor market returns to normal”—a view that seems to ignore the fact that the tight correlation between wage and productivity growth began to deteriorate long before today’s college students were born.
*
Figure 2.2. Productivity Growth Versus Compensation Growth
S
OURCE
: US Bureau of Labor Statistics.
14
A Bear Market for Labor’s Share, and a Raging Bull for Corporations
Early in the twentieth century, the British economist and statistician Arthur Bowley delved into decades of national income data for the United Kingdom and showed that the fraction of national income going to labor and capital respectively remained relatively constant, at least over long periods. This apparently fixed relationship ultimately became an accepted economic principle known as “Bowley’s Law.” John Maynard Keynes, perhaps the most famous economist of all time, would later say that Bowley’s Law was “one of the most surprising, yet best established facts in the whole range of economic statistics.”
17
As
Figure 2.3
shows, during the postwar period, the share of US national income going to labor moved in a fairly tight range, just as
Bowley’s Law would have predicted. From the mid-1970s on, however, Bowley’s Law began to fall apart as labor’s share went first into a gradual decline and then into a seeming free fall just after the turn of the century. The decline is all the more remarkable when we consider that labor’s share includes anyone who draws a paycheck. In other words, the enormous salaries of CEOs, Wall Street executives, superstar athletes, and movie stars are all considered labor, and those, of course, haven’t been declining at all: they’ve been skyrocketing. A graph showing the share of national income accruing to ordinary workers—or, more broadly, the bottom 99 percent of the income distribution—would certainly show an even more precipitous plunge.
Figure 2.3. US Labor’s Share of National Income (1947–2014)

S
OURCE
: US Bureau of Labor Statistics and Federal Reserve Bank of St. Louis (FRED).
18
While labor’s share of income plummeted, the story was very different for corporate profits. In April 2012, the
Wall Street Journal
ran a story entitled “For Big Companies, Life Is Good” that documented the astonishing speed at which corporations recovered from the most severe economic crisis since the Great Depression. While millions of
workers remained unemployed or accepted jobs at lower pay or with fewer hours, the corporate sector emerged from the downturn “more productive, more profitable, flush with cash and less burdened by debt.”
19
Over the course of the Great Recession, corporations had become adept at producing more with fewer workers. In 2011, big companies generated an average of $420,000 in revenue for each employee, an increase of more than 11 percent over the 2007 figure of $378,000.
20
Spending on new plants and equipment, including information technology, by S&P 500 companies had doubled from the year before, bringing capital investment as a percentage of revenue back to pre-crisis levels.