The 80/20 Principle: The Secret of Achieving More With Less (10 page)
Read The 80/20 Principle: The Secret of Achieving More With Less Online
Authors: Richard Koch
Tags: #Non-Fiction, #Psychology, #Self Help, #Business, #Philosophy

We have not yet found the 20 percent of sales that account for 80 percent of profits, but we are on our way. If not 80/20, then 67/30: 30 percent of product sales account for almost 67 percent of profits. Already you may be thinking about what can be done to raise the sales of Product groups A, B, and C. For example, you might want to reallocate all sales effort from the other 80 percent of business, telling salespeople to concentrate on doubling the sales of Products A, B, and C and not to worry about the rest. If they succeeded in doing this, sales would only go up by 20 percent, but profits would rise more than 50 percent.
You might also already be thinking about cutting costs, or raising prices, in Product groups D, E, and F; or about radical retrenchment or total exit from Product groups G and H.
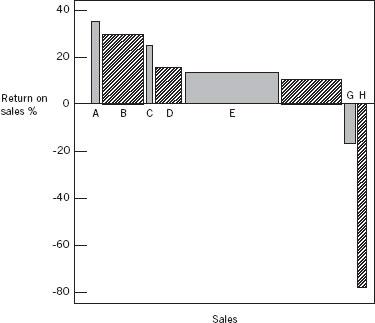
Figure 11 Electronic Instruments Inc. sales and profits chart by product group
Percentage of sales | Percentage of profits | |||
Product | Group | Cumulative | Group | Cumulative |
Product group A | 3.1 | 3.1 | 9.9 | 9.9 |
Product group B | 14.2 | 17.3 | 38.2 | 48.1 |
Product group C | 2.6 | 19.9 | 4.6 | 52.7 |
Product group D | 10.1 | 30.0 | 14.1 | 66.8 |
Product group E | 37.0 | 67.0 | 39.5 | 106.3 |
Product group F | 25.4 | 92.4 | 22.4 | 128.7 |
Product group G | 4.2 | 96.6 | (6.1) | 122.6 |
Product group H | 3.4 | 100.0 | (22.6) | 100.0 |
Figure 12 Electronic Instruments Inc. 80/20 Table
WHAT ABOUT CUSTOMER PROFITABILITY?
After products, go on to look at
customers.
Repeat the analysis, but look at total purchases by each customer or customer group. Some customers pay high prices but have a high cost to serve: these are often smaller customers. The very big customers may be easy to deal with and take large volumes of the same product, but screw you down on price. Sometimes these differences balance out, but often they do not. For the group we are calling Electronic Instruments Inc. the results are shown in Figures 14 and 15.
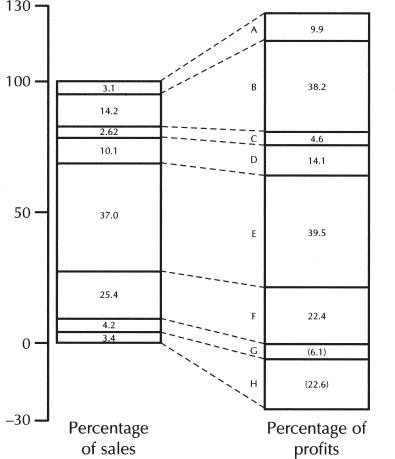
Figure 13 Electronic Instruments Inc. 80/20 Chart
$000 | |||
Customer | Sales | Income | Return on sales (%) |
Customer type A | 18,350 | 7,865 | 42.9 |
Customer type B | 11,450 | 3,916 | 34.2 |
Customer type C | 43,100 | 3,969 | 9.2 |
Customer type D | 46,470 | (2,370) | (5.1) |
Total | 119,370 | 13,380 | 11.2 |
Figure 14 Electronic Instruments Inc. sales and profits table by customer group
A word of explanation about the customer groups. Type A customers are small, direct accounts paying very high prices and giving very fat gross margins. They are quite expensive to service but the margins more than compensate for this. Type B customers are distributors who tend to place large orders and have very low costs to serve, yet for one reason or another find it acceptable to pay fairly high prices, mainly because the electronic components bought are a tiny fraction of their total product costs. Type C customers are export accounts paying high prices. The snag with them, however, is that they are very expensive to service. Type D customers are large manufacturers who bargain very hard on price and also demand a great deal of technical support and many “specials.”
Figures 16 and 17 show the 80/20 Table and 80/20 Chart respectively for the customer groups.
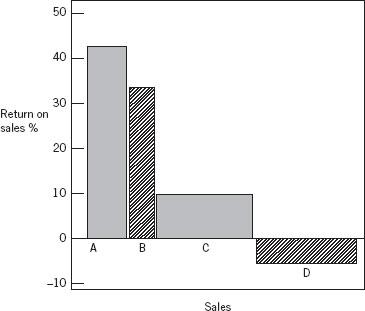
Figure 15 Electronic Instruments Inc. sales and profits chart by customer group
Percentage of sales | Percentage of profits | |||
Customer | Type | Cumulative | Type | Cumulative |
Customer type A | 15.4 | 15.4 | 58.9 | 58.9 |
Customer type B | 9.6 | 25.0 | 29.3 | 88.2 |
Customer type C | 36.1 | 61.1 | 29.6 | 117.8 |
Customer type D | 38.9 | 100.0 | (17.8) | 100.0 |
Figure 16 Electronic Instruments Inc. 80/20 Table by customer type
These figures reveal a 59/15 rule and an 88/25 rule: the most profitable customer category accounts for 15 percent of revenues but 59 percent of profits, and the most profitable 25 percent of customers yields 88 percent of profits. This is partly because the most profitable customers tend to take the most profitable products, but also because they pay more in relation to their cost to service.
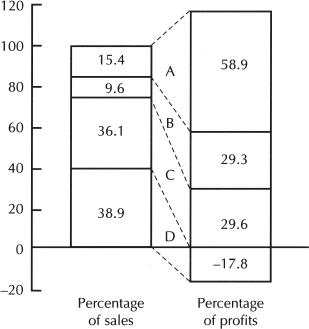
Figure 17 Electronic Instruments Inc. 80/20 Chart by customer type
The analysis led to a successful campaign to find more A and B customers: the small direct customers and the distributors. Even taking account of the cost of the campaign, the result was very profitable. Prices for C customers (the export accounts) were selectively raised and ways found to lower the cost of servicing some of them, particularly by greater use of telephone rather than face-to-face selling. The D customers (large manufacturers) were dealt with individually: nine of these accounted for 97 percent of D sales. In some cases technical development services were charged for separately; in others prices were raised; and three accounts were tactically “lost” to the company’s most hated competitor after a bidding war. The managers really wanted the competitor to enjoy these losses!
80/20 ANALYSIS APPLIED TO A CONSULTANCY FIRM
After products and customers, take any other split of business that appears especially relevant to your business. There was no special analysis in the case of the instrumentation company, but to illustrate the point consider the simple split of sales and profits for a strategy consultancy shown in Figures 18 and 19.
$000 | |||
Business split | Sales | Profits | Return on sales (%) |
Large projects | 35,000 | 16,000 | 45.7 |
Small projects | 135,000 | 12,825 | 9.5 |
Total | 170,000 | 28,825 | 17.0 |
Figure 18 Strategy Consulting Inc. table of profitability of large versus small clients
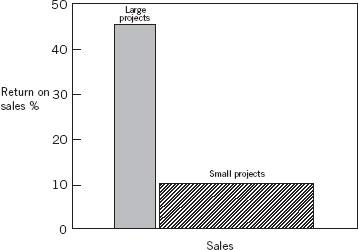
These figures exhibit a 56/21 rule: large projects constitute only 21 percent of turnover but give 56 percent of profits.
Another analysis, shown in Figures 20 and 21, splits the business into “old” clients (more than three years old), “new” clients (less than six months old), and those in between.
