The 80/20 Principle: The Secret of Achieving More With Less (11 page)
Read The 80/20 Principle: The Secret of Achieving More With Less Online
Authors: Richard Koch
Tags: #Non-Fiction, #Psychology, #Self Help, #Business, #Philosophy

Figure 19 Strategy Consulting Inc. chart of profitability of large versus small clients
$000 | |||
Business split | Sales | Profits | Return on sales (%) |
Old clients | 43,500 | 24,055 | 55.3 |
Intermediate clients | 101,000 | 12,726 | 12.6 |
New clients | 25,500 | (7,956) | 31.2 |
Total | 170,000 | 28,825 | 17.0 |
Figure 20 Strategy Consulting Inc. table of profitability of old versus new clients
These figures tell us that 26 percent of the business (old clients) made up 84 percent of the profits: an 84/26 rule. The message here was to strive above all to keep and expand long-serving clients, who were the least price sensitive and who could be served most cheaply. New clients who do not turn into long-serving clients were recognized as being loss makers, leading to a much more selective approach to pitching for business: pitches were only made where it was believed the company concerned would turn into a long-term client.
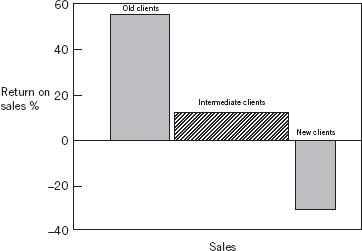
Figure 21 Strategy Consulting Inc. chart of profitability of old versus new clients
Figures 22 and 23 summarize a third analysis for the consultants, which divided projects into work on mergers and acquisitions (M&A), strategic analysis, and operational projects.
This split demonstrated an 87/22 rule: the M&A work was wildly profitable, giving 87 percent of profits for 22 percent of revenues. Efforts were redoubled to sell more M&A work!
$000 | |||
Business split | Sales | Profits | Return on sales (%) |
M&A | 37,600 | 25,190 | 67.0 |
Strategic analysis | 75,800 | 11,600 | 15.3 |
Operational projects | 56,600 | 7,965 | 14.1 |
Total | 170,000 | 28,825 | 17.0 |
Figure 22 Strategy Consulting Inc. table of profitability by project type
Operational projects for old clients, when analyzed separately, turned out at about break-even, while large losses were made on operational projects for new clients. This led to a decision not to undertake the latter, while old clients were either charged much more for this kind of project or encouraged to farm them out to specialist operational consultancies.
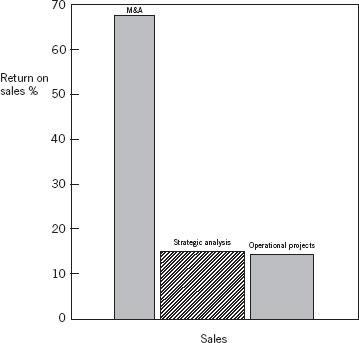
Figure 23 Strategy Consulting Inc. chart of possibility by project type
SEGMENTATION IS THE KEY TO UNDERSTANDING AND DRIVING UP PROFITABILITY
The best way to examine the profitability of your business is to break it down into
competitive segments.
While analyses by product, customer, or any other relevant split are usually very valuable, the greatest insights come from a combination of customers and products into “dollops” of business defined with reference to your most important competitors. Although this is not as difficult as it may sound, very few organizations break up their business in this way, so a short exposition is necessary.
What is a competitive segment?
A competitive segment is a part of your business where you face a different competitor or different competitive dynamics.
Take any part of your business that comes to mind: a product, a customer, a product line sold to a customer type, or any other split that may be important to you (for example, consultants may think of M&A work). Now ask yourself two simple questions:
•
Do you face a different main competitor in this part of your business compared to the rest of it?
If the answer is yes, then that part of the business is a separate competitive segment (or simply segment for short).
If you are up against a specialist competitor, your profitability will depend on the interaction of your product and service against theirs. Which do consumers prefer? And what is your total cost to deliver the product or service relative to your competitor’s? Your profitability will be as much determined by your competitor as by anything else.
It is therefore sensible to think of this area of your business separately, to determine a strategy for it that will beat (or collude with) your competitor. It is certainly sensible to look at its profitability separately too: you may have a surprise.
But even if the part of your business you are looking at has the same competitor as another part of your business (for example, your main competitor in Product A is the same as in Product B), then you need to ask another question.
•
Do you and your competitor have the same ratio of sales or market share in the two areas, or are they relatively stronger in one area and you relatively stronger in another?
For example, if you have 20 percent market share in Product A and the largest competitor has 40 percent (they are twice as big as you), is it the same ratio in Product B: are they twice as big as you there? If you have 15 percent market share in Product B but your competitor only has 10 percent, then there is a different relative competitive position in the two products.
There will be real reasons for this. Consumers may prefer your brand in Product B but your competitor’s in Product A. Possibly the competitor doesn’t care much about what happens in Product B. Perhaps you are efficient and price competitive in Product B, whereas the reverse is true in Product A. At this stage you don’t need to know the reasons. All you need to do is observe that, although you face the same competitor, the balance of advantage is different in the two areas. They are therefore separate segments and will probably exhibit different profitability.
Thinking about competitors puts you straight on to the key business splits
Instead of starting with a conventional business definition, such as a product or the output from different parts of your organization, thinking about competitive segments lobs you straight at the most important way to split and think about your business.
At the instrumentation company referred to earlier, managers just could not agree among themselves how to analyze the business. Some thought that products were the key dimension. The view of others was that the most important split was whether the customers were in the pipeline business (broadly, oil companies) or in continuous process industries (such as food manufacturers). A third faction held that the U.S. business was very different from the export business. Since they started from different assumptions, all of which were to some degree valid, it was very difficult to make progress either in organizing the business or in communicating with each other.
Dividing the business into competitive segments demolished these arguments. The rule is simple: if you don’t face different competitors, or different relative competitive positions, it’s not a separate segment. We quickly arrived at a rather inelegant, but very clear, set of segments that everyone could understand.
For a start, it was clear that the competitors were very different in most, but not all, products. Where the competitors were the same, with similar relative competitive positions, we lumped the products together. In most other cases we kept the products apart.
Then we asked whether the competitive positions were different for pipeline customers as distinct from process customers. In all but one product, the answer was no. But in that one product, liquid density machines, the largest competitors were different. We therefore settled for two segments here: liquid density pipeline and liquid density process.
Finally, we asked whether the competitors or competitive positions were different in each segment in the United States and in international business. In most cases the answer was yes. If the international business was significant enough, we asked the same question for different countries: was it the same competitor in Great Britain as in France or Asia? Where the competitors were different, we subdivided the business into separate segments.
We ended up with a patchwork quilt of 15 large segments (very small ones we reaggregated to avoid unnecessary work), usually defined by product and geographic region, but in one case by product and customer type (this was liquid density, where the segments were liquid density pipeline worldwide and liquid density process worldwide). Each segment had a different competitor or different competitive positions. We then analyzed the split of sales and profits for each of the segments, and this is shown in Figures 24 and 25.
$000 | |||
Segment | Sales | Profits | Return on sales (%) |
1 | 2,250 | 1,030 | 45.8 |
2 | 3,020 | 1,310 | 43.4 |
3 | 5,370 | 2,298 | 42.8 |
4 | 2,000 | 798 | 39.9 |
5 | 1,750 | 532 | 30.4 |
6 | 17,000 | 5,110 | 30.1 |
7 | 3,040 | 610 | 25.1 |
8 | 7,845 | 1,334 | 17.0 |
9 | 4,224 | 546 | 12.9 |
10 | 13,000 | 1,300 | 10.0 |
11 | 21,900 | 1,927 | 8.8 |
12 | 18,100 | 779 | 4.3 |
13 | 10,841 | (364) | (3.4) |
14 | 5,030 | (820) | (15.5) |
15 | 4,000 | (3,010) | (75.3) |
Total | 119,370 | 13,380 | 11.2 |