Read The Bell Curve: Intelligence and Class Structure in American Life Online
Authors: Richard J. Herrnstein,Charles A. Murray
Tags: #History, #Science, #General, #Psychology, #Sociology, #Genetics & Genomics, #Life Sciences, #Social Science, #Educational Psychology, #Intelligence Levels - United States, #Nature and Nurture, #United States, #Education, #Political Science, #Intelligence Levels - Social Aspects - United States, #Intellect, #Intelligence Levels
The Bell Curve: Intelligence and Class Structure in American Life (109 page)

| Whole-Model Test | ||||
|---|---|---|---|---|
| Source | DF | -LogLikelihood | ChiSquare | Prob>ChiSq |
| Model | 3 | 3.26859 | 6.537177 | 0.088208 |
| Error | 398 | 200.09145 | | |
| C Total | 401 | 203.36004 | | |
| | RSquare (U) | 0.0161 | | |
| | Observations | 402 | |
| Parameter Estimates | ||||
|---|---|---|---|---|
| Term | Estimate | Std Error | ChiSquare | Prob>ChiSq |
| Intercept | +0.99516202 | 0.2386798 | 17.38 | 0.0000 |
| zAFQT89 | +0.39251349 | 0.1988073 | 3.90 | 0.0483 |
| zSES | +0.03692158 | 0.168585 | 0.05 | 0.8266 |
| zAge | +0.13876137 | 0.1336384 | 1.08 | 0.2991 |
Supplemental Material for Chapter 13
Four issues raised in Chapter 13 are elaborated here: test bias, narrowing of the black-white difference in academic test scores, the broader argument for racial differences advanced by Philippe Rushton, and possible language bias against Latinos in the NLSY data.
In Chapter 13, we reported that the scientific evidence demonstrates overwhelmingly that standardized tests of cognitive ability are not biased against blacks. Here, we elaborate on the reasoning and evidence that lead to that conclusion.
Everyday commentary on test bias usually starts with the observation that members of various ethnic (or socioeconomic) groups have different average scores and leaps to the assumption that a group difference is prima facie evidence of bias. But a moment’s thought should convince anyone that this is not necessarily so. A group difference is, in and of itself, evidence of test bias only if we have some reason for assuming that an unbiased test would find no average difference between the groups. What might such a reason be? We cast the answer in terms of whites and blacks, since that is the context for most charges of test bias. Inasmuch as the context also usually involves a criticism of the use of the test in selection of persons for school or job, the most pertinent reason for assuming equality in the absence of test bias would be that we have other data showing that a randomly selected black and white with the same test score have different outcomes. This is what the text refers to as external evidence of bias.
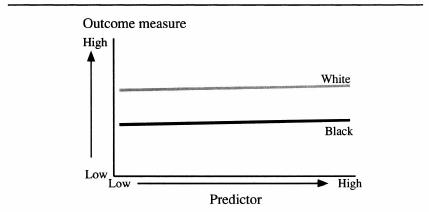
If for example, blacks do better in school than whites after choosing blacks and whites with equal test scores, we could say that the test was biased against blacks in academic prediction. Similarly, if they do better on the job after choosing blacks and whites with equal test scores, the test could be considered biased against blacks for predicting work performance. This way of demonstrating bias is tantamount to showing that the regression of outcomes on scores differs for the two groups. On a test biased against blacks, the regression intercept would be higher for blacks than whites, as illustrated in the graphic below. Test scores under these conditions would underestimate, or “underpredict,” the performance outcome of blacks. A randomly selected black and white with the same IQ (shown by the vertical broken line) would not have equal outcomes; the black would outperform the white (as shown by the horizontal broken lines). The test is therefore biased against blacks. On an unbiased test, the two regression lines would converge because they would have the same intercept (the point at which the regression line crosses the vertical axis).
When a test is biased because it systematically underpredicts one group’s performance
But the graphic above captures only one of the many possible manifestations of predictive bias. Suppose, for example, a test was less valid for blacks than for whites.
1
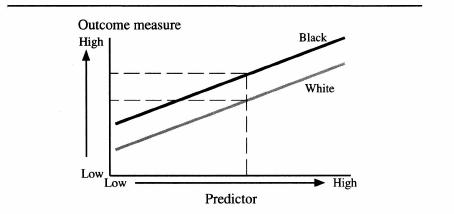
In regression terms, this would translate into a smaller coefficient (slope in these graphics), which could, in turn, be associated either with or without a difference in the intercept. The next figure illustrates a few hypothetical possibilities.
All three black lines have the same low coefficient; they vary only
in their intercepts. The gray line, representing whites, has a higher coefficient (therefore, the line is steeper). Begin with the lowest of the three black lines. Only at the very lowest predictor scores do blacks score higher than whites on the outcome measure. As the score on the predictor increases, whites with equivalent predictor scores have higher outcome scores. Here, the test bias is against whites, not blacks. For the intermediate black line, we would pick up evidence for test bias against blacks in the low range of test scores and bias against whites in the high range. The top black line, with the highest of the three intercepts, would accord with bias against blacks throughout the range, but diminishing in magnitude the higher the score.
When a test is biased because it is a less valid predictor of performance for one group than another
Readers will quickly grasp that test scores can predict outcomes differently for members of different groups and that such differences may justify claims of test bias. So what are the facts? Do we see anything like the first of the two graphics in the data—a clear difference in intercepts, to the disadvantage of blacks taking the test? Or is the picture cloudier—a mixture of intercept and coefficient differences, yielding one sort of bias or another in different ranges of the test scores? When questions about data come up, cloudier and murkier is usually a safe bet. So let us start with the most relevant conclusion, and one about which there is virtual unanimity among students of the subject of predictive bias in testing:
No one has found statistically reliable evidence of predictive bias against blacks, of the sort illustrated in the first graphic, in large, representative samples of blacks and whites, where cognitive ability tests are the predictor variable for educational achievement or job performance.
In the notes,
we list some of the larger aggregations of data and comprehensive analyses substantiating this conclusion.
2
We have found no modern, empirically based survey of the literature on test bias arguing that tests are predictively biased against blacks, although we have looked for them.
When we turn to the hundreds of smaller studies that have accumulated in the literature, we find examples of varying regression coefficients and intercepts, and predictive validities. This is a fundamental reason for focusing on syntheses of the literature. Smaller or unrepresentative individual studies may occasionally find test bias because of the statistical distortions that plague them. There are, for example, sampling and measurement errors, errors of recording, transcribing, and computing data, restrictions of range in both the predictor and outcome measurements, and predictor or outcome scales that are less valid than they might have been.
3
Given all the distorting sources of variation, lack of agreement across studies is the rule.
But even taken down to so fine a level, the case against predictive bias against blacks remains overwhelming. As late as 1984, Arthur Jensen was able to proclaim that “I have not come across a bona fide example of the opposite finding [of a test that underpredicts black performance].”
4
Jensen’s every finding regarding racial differences in IQ is routinely subjected to intense scrutiny by his critics, but no one has contradicted this one. We are not absolutely sure that our literature review has identified every study since 1984, but our search revealed no examples to counter Jensen’s generalization.
5
Insofar as the many individual studies show a pattern at all, it points to overprediction for blacks. More simply, this body of evidence suggests that IQ tests are biased in favor of blacks, not against them. The single most massive set of data bearing on this issue is the national sample of more than 645,000 school children conducted by sociologist James Coleman and his associates for their landmark examination of the American educational system in the mid-1960s. Coleman’s survey included a standardized test of verbal and nonverbal IQ, using the kinds of items that characterize the classic IQ test and are commonly thought to be culturally biased against blacks: picture vocabulary, sentence completion, analogies, and the like. The Coleman survey also included educational achievement measures of reading level and math level that are thought to be straightforward measures of what the student has learned. If IQ items are culturally biased against blacks, it could be predicted that a black student would do better on the achievement measures
than the putative IQ measure would lead one to expect (this is the rationale behind the current popularity of steps to modify the SAT so that it focuses less on aptitude and more on measures of what has been learned). But the opposite occurred. Overall, black IQ scores overpredicted black academic achievement by .26 standard deviations.
6
One inference that might be drawn from this finding is that black children were for some reason not taking as much from school as their ability would permit, or that black children went to worse schools than white children, or any of several other interpretations. But whatever the explanation might be, the results directly contradict the hypothesis that IQ tests give an unfairly low estimate of black academic performance.
A second major source of data suggesting that standardized tests over-predict black performance is the SAT. Colleges commonly compare the performance of freshmen, measured by grade point average, against the expectations of their performance as predicted by SAT scores. A literature review of studies that broke down these data by ethnic group revealed that SAT scores overpredicted freshman grades for blacks in fourteen of fifteen studies, by a median of .20 standard deviation.
7
In five additional studies where the ethnic classification was “minority” rather than specifically “black,” the SAT score overpredicted college performance in all five cases, by a median of .40 standard deviation.
8
For job performance, the most thorough analysis is provided by the Hartigan Report, assessing the relationship between the General Aptitude Test Battery (GATB) and job performance measures. Out of seventy-two studies that were assembled for review, the white intercept was higher than the black intercept in sixty of them—that is, the GATB overpredicted black performance in sixty out of the seventy-two studies.
9
Of the twenty studies in which the intercepts were statistically significantly different (at the .01 level), the white intercept was greater than the black intercept in all twenty cases.
10
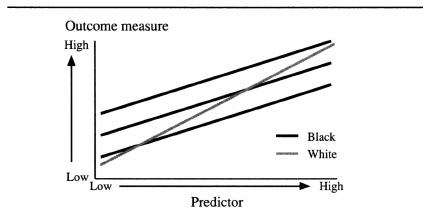
These findings about overprediction apply to the ordinary outcome measures of academic and job performance. But it should also be noted that “overprediction” can be a misleading concept when it is applied to outcome measures for which the predictor (IQ, in our continuing example) has very low validity. Inasmuch as blacks and whites differ on average in their scores on some outcome that is not linked to the predictor, the more biased it will be against whites. Consider the next figure, constructed on the assumption that the predictor is nearly invalid and that the two groups differ on average in their outcome levels.
A predictor with low validity may seem to be biased against whites if there is a substantial difference in the outcome measure