Read The Bell Curve: Intelligence and Class Structure in American Life Online
Authors: Richard J. Herrnstein,Charles A. Murray
Tags: #History, #Science, #General, #Psychology, #Sociology, #Genetics & Genomics, #Life Sciences, #Social Science, #Educational Psychology, #Intelligence Levels - United States, #Nature and Nurture, #United States, #Education, #Political Science, #Intelligence Levels - Social Aspects - United States, #Intellect, #Intelligence Levels
The Bell Curve: Intelligence and Class Structure in American Life (70 page)

Letting people develop to their fullest potential is not the only important goal of public education. Since the founding of the republic, thoughtful Americans have recognized that an educated citizenry is vital to its survival. This chapter therefore examines how well our country fares in educating the average student—not the one who is likely to occupy a place among the cognitive elite but the one most representative of the typical American. We find that the average American youngster is probably doing better on tests of academic skills than ever before. We will try to understand why a sense of crisis nevertheless surrounds American education despite this unexpected good news.
We begin with quantitative evidence that shows the general outline of these trends and their connection to each other. Then we switch to observations of the kind that do not lend themselves to survey results or regression equations but that we believe to be justified by everyday experience in our schools and colleges.
A few years ago, the
Wall Street Journal
devoted its op-ed page to a reproduction of an examination administered by Jersey City High School in 1885.
1
It consisted of questions such as the following:
Find the product of 3 + 4× + 5×2 − 6×3 and 4 − 5× − 6×2.
Write a sentence containing a noun used as an attribute, a verb in the perfect tense potential mood, and a proper adjective.
Name three events of 1777. Which was the most important and why?
The test was not for high school graduation (which would be impressive enough) but for
admission
to Jersey City High School. Fifteen-year-olds were supposed to know the answers to these questions. Of course, not many people went to high school in 1885. But could even the cream of the 15-year-olds in Jersey City’s middle schools pass that exam today? It seems unlikely.
Bits of national memorabilia like this reinforce an impression that is nearly universal in this country: American elementary and secondary education used to be better. The 1983 report by the Department of Education,
A Nation at Risk,
said so most famously, concluding that “we have, in effect, been committing an act of unthinking, unilateral educational disarmament.”
2
Its chairman concluded flatly that “for the first time in the history of our country, the educational skills of one generation will not surpass, will not equal, will not even approach, those of their parents.”
3
We begin by affirming the conventional wisdom in one respect: The academic performance of the average American student looks awful at first glance. Consider illiteracy, for example. Some authorities claim that a third of the population is functionally illiterate.
4
No one really knows—when does “literacy” begin?—but no matter where the precise figure lies, the proportion is large. As of 1990, 16 percent of the 17-year-olds still in school were below the level called “intermediate” in the National Assessment of Educational Progress (NAEP) reading test—in effect, below the threshold for dealing with moderately complex written material.
5
Then one must consider that more than 20 percent of 17-year-olds had already dropped out of school and were not part of the sample,
6
bringing us somewhere above 20 percent of the population who cannot use reading as a flexible tool of daily life.
There is a profusion of horror stories in other subjects. Fewer than one in three American 17-year-olds in a nationally representative sample could place the Civil War within the correct half-century of its actual occurrence.
7
Fewer than 60 percent of American 17-year-olds could correctly answer the item, “A hockey team won five of its 20 games. What percent of the games did it win?”
8
More than 60 percent of adults in their early twenties cannot synthesize the main argument of a newspaper article.
9
Forty-four percent of adult Americans cannot understand “help wanted” ads well enough to match their qualifications with the job requirements. Twenty-two percent cannot address a letter well enough to make sure the post office can deliver it.
10
Critics of American education also point to international comparisons. Between the early 1960s and the end of the 1980s, six major international studies compared mathematical competence, science knowledge, or both, across countries.
11
The National Center for Education Statistics has conveniently assembled all of the results for the first five studies in a series of twenty-two tables showing the United
States’ ranking for each scale. The results for the industrialized countries are easily summarized: In seven of the twenty-two tables, the United States is at the very bottom; in eight others, within two countries of the bottom; in four of the remaining seven, in the bottom half.
12
The most recent study, conducted in 1991, found that the United States continued to rank near the bottom on every test of every age group for the math tests and near the middle on the science tests.
13
International comparisons need to be interpreted cautiously.
14
But the most common defense for America’s poor showing is losing credibility. For years, educators excused America’s performance as the price America pays for retaining such a high proportion of its students into high school. But Japan has had as high a retention rate for years, and recently many European nations, including some that continue to outscore us on the international tests, have caught up as well.
15
The picture is surely depressing. But as we look back to the idealized America of the earlier part of the century, can we catch sight of American school children who, on average, would have done any better on such measures than the youngsters of today? A growing number of educational researchers are arguing that the answer is no.
16
With qualifications that the chapter will explain, we associate ourselves with their findings.
According to every longitudinal measure that we have been able to find, there is no evidence that the preparation of the average American youth is worse in the 1990s than it has ever been.
Considerable evidence suggests that, on the contrary, education for the average youth has improved steadily throughout the twentieth century except for a period of decline in the late 1960s and early 1970s (which justified to some degree the alarming conclusions of the early 1980s) but from which the educational system has already fully recovered. How can we get away with these statements that seem so contrary to what everyone knows? We do it by means of that innocuous word, “average.”
During the first half of the twentieth century, education for the average American young person improved steadily, partly because the average American young person spent more time in school than previously (Chapter 6). But much other evidence, marshaled convincingly by economist John Bishop, indicates a steady, long-term improvement in what Bishop calls “general intellectual achievement” that extended from the earliest data at the turn of the century into the 1960s.
17
Even if we discount some of these results as reflections of the Flynn effect,
18
it is impossible to interpret the data from 1900 to 1950 as showing anything other than some improvement. Then in the mid-1960s began a period of decline, as manifested most notably by the fall in SAT scores. Many people are under the impression that the decline was deep and permanent for the entire population of students. In reality, the decline for the
average
student was modest and recovery was quick. We know this first through the NAEP, begun in 1969, which we discussed with regard to ethnic differences in Chapter 13.
19
When the first NAEP tests were given, the SAT score decline was in its fifth year and would continue for most of the next decade. The SAT is generally for a population concentrated at the upper end of the cognitive ability distribution, whereas the NAEP is for a nationally representative sample. While the scores for the population taking the SAT were still declining, the trendlines of the NAEP results were flat. The differences between the earliest NAEP scores in reading, science, and math (which date from 1969 to 1973, depending on the test) and the scores in 1990 are a matter of a few points and small fractions of a standard deviation, and scores often went up rather than down over that period.
20
SAT scores had started declining in 1964, but the NAEP goes back only to 1969. To reach back further for nationally representative data, we turn first to five almost completely unpublicized studies, known collectively as the national norm studies, conducted by the Educational Testing Service (ETS) in 1955, 1960, 1966, 1974, and 1983. In these tests, a short version of the SAT (the Preliminary Scholastic Aptitude Test, or PSAT) was administered to a nationally representative sample of American high school juniors. The results are summarized in the table below, adjusted so as to represent the mean score that
all
American juniors would have received on the SAT had they stayed in school for their senior years and had they taken the SAT.
| What SAT Score Decline? The Results of the National Norm Studies, 1955-1983 | ||
|---|---|---|
| Year | Verbal Mean | Math Mean |
| Sources: Cole 1955; Chandler and Schrader 1966; Katz and others 1970; Jackson and Schrader 1976; Braun, Centra, and King 1987. | ||
| 1955 | 348 | 417 |
| 1960 | 374 | 410 |
| 1966 | 383 | 395 |
| 1974 | 368 | 402 |
| 1983 | 376 | 411 |
These results say that American eleventh graders as of 1983 were, as a whole, roughly as well prepared in both verbal and math skills as they had been when the college-bound SAT scores were at their peak in 1963, and noticeably stronger in their verbal skills than they had been in the first norm study in 1955. The decline in verbal scores between the 1966 and 1974 tests was 15 points—only about .14 standard deviation. About half of that had been recovered by the 1983 test.
21
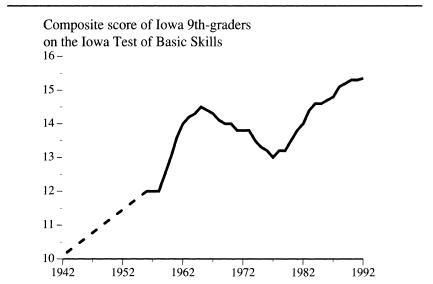
A third source is the Iowa Test of Educational Development (ITED), a well-validated test, equated for stability from year to year, that has been administered to virtually a 100 percent sample of Iowa’s high school students for fifty years. What may one learn from rural, white Iowa? For examining trends in educational outcomes over time, quite a bit. Iowa’s sample of students provides socioeconomic variance—even Iowa has single-parent families and welfare recipients. Paradoxically, Iowa’s atypical racial homogeneity (the population was more than 97 percent non-Latino white throughout the period we are discussing) is an advantage for a longitudinal analysis by sidestepping the difficulties of analyzing trends for populations that are changing in their ethnic composition. In examining Iowa’s test scores over time, we may not be able to make judgments about how the education of minorities has changed but we have a good view of what happened over the last several decades for the white population.
Test scores for high school students in Iowa increased from the early 1940s to the mid-1960s, dropped sharply from 1966 to 1978, but then rebounded, as shown in the figure below. We show the ninth-grade scores, which have been least affected by changes in dropout rates during the last fifty years. They show a steep rise through 1965 and an equally steep rise after 1977, reaching new heights from 1983 onward.
22
The improvement has been substantial—on the order of half a standard deviation since the mid-1970s, and about .2 standard deviation above the previous high in 1965. The increase of 5.3 points from 1942 to 1992 may be interpreted as approaching one standard deviation.
Evidence from other, independent sources is consistent with the story told by the national norm studies and the Iowa data. Project TALENT, the huge study of high school students undertaken in 1960, readministered its reading comprehension test in 1970 to another sample and found that a nationally representative sample of eleventh graders had gained slightly over its counterpart of 1960, during the same decade that saw the steepest decline in the SAT. Other data on state tests in Virginia, New York, Texas, and California, summarized by the Congressional Budget Office in its study of trends in educational achievement, cannot match the time range of the Iowa or SAT norm data, but, within their limits, they are generally consistent with the picture we have sketched.
23
Even the international assessments are consistent. The United States had some of its worst results in the first international assessment, conducted in the early to mid-1960s when American SAT scores were near their peak.
24
Since then, the national American averages have been, on balance, rising and the deficit in international comparisons shrinking.
A half-century of Iowa tests: Improvement as the norm, the slump as a twelve-year aberration