Read The Bell Curve: Intelligence and Class Structure in American Life Online
Authors: Richard J. Herrnstein,Charles A. Murray
Tags: #History, #Science, #General, #Psychology, #Sociology, #Genetics & Genomics, #Life Sciences, #Social Science, #Educational Psychology, #Intelligence Levels - United States, #Nature and Nurture, #United States, #Education, #Political Science, #Intelligence Levels - Social Aspects - United States, #Intellect, #Intelligence Levels
The Bell Curve: Intelligence and Class Structure in American Life (78 page)

Consider the next pair of folders, with two applicants from privileged backgrounds (the upper right-hand cell). One is at the 57th centile of college students, the other at the 23d centile, corresponding to almost a standard deviation difference. Is it reasonable to choose each with equal likelihood if the one at the 23d centile is black, as the typical admissions officer now does?
How might one justify the upper left cell, representing the privileged black versus the disadvantaged white, where the edge given to the black candidate should be no greater than zero under any plausible rationale for affirmative action (or so we argue), and probably should be less than zero? A disadvantaged white youth with cognitive ability at the 36th centile of college youths now has the same chance of being admitted as a privileged black youth at the 17th centile.
Finally, consider the lower right cell, the one that most closely fits the image of affirmative action, in which a privileged white is competing with a disadvantaged black. The logic of affirmative action implies a substantial difference in the qualifications of two youths fitting this description who have an equal chance of being admitted. Is the difference actually observed—between a white at the 57th percentile of college students and one at the 12th percentile—a reasonable one? In IQ terms, this is a difference of almost nineteen points.
We do not suppose that admissions officers have these folders side by side as they make their decisions. In fact, given the pressures on admissions committees, the determining factor for admission is often the sheer numbers of minority applicants. If the percentage of minorities in the incoming freshman class goes up, that is considered good. If the percentage goes down, that is considered bad. To make the numbers come out right, the admissions committee feels pressed to dig deeper into the pool of available applicants if necessary. They do not want to admit unqualified minority candidates, nor do they want to prefer advantaged minority applicants over disadvantaged whites. But these questions arise, if they arise at all, only after the more pressing matter of minority representation is attended to. The goal is to have “enough” blacks and other minorities in the incoming class. Meanwhile, white applicants are judged in competition with other white candidates, using the many criteria that have always been applied.
The main purpose of the exercise we have just conducted is to suggest that admissions committees should be permitted to behave a little more like our imaginary one than they are at present, given the pressures from higher levels in the university. If university officials think that these data are not adequate for the purposes we have used them, or if they think that we have misrepresented the affirmative action process, there is an easy remedy. Universities across the country have in their admissions files all the data needed for definitive analyses of the relationship of ethnicity, socioeconomic disadvantage, and academic ability—test data, grade data, parental background data in profusion—for students who were accepted and students who were rejected, students who enrolled and students who did not. At many schools, the data are already in computer files, ready for analysis. They may readily be made available to scholars without compromising confidentiality. Our proposition is that affirmative action as it is currently practiced in America’s universities has lost touch with any reasonable understanding of the logic and purposes of affirmative action. It is easy to put this proposition to the test.
The success of affirmative action in the university is indisputable, in the sense that a consciously designed public policy, backed by the enthusiastic
cooperation of universities, drastically increased the number of minority students who attend and graduate from college. The magnitude of the success during the first flush of affirmative action is apparent in the figure below, which shows the result for black enrollments.
30
When aggressive affirmative action began, black college enrollment surged for a decade

Source:
U.S. Bureau of the Census 1975, 1993, various editions.
In 1967, black enrollment of 20-24-year-olds suddenly shot up, and continued to rise steeply through the mid-1970s. White enrollment experienced no comparable surge during that period. The most plausible cause of the surge is the aggressive affirmative action that began in the mid-1960s. On the other hand, this figure previews a problem we will discuss at more length in the next chapter: Whatever initial impetus was provided by affirmative action, it soon lost momentum. Black enrollment in the early 1990s was higher than the trendline from 1950 to 1966 would have predicted, but some sort of evening-out process seems to have set in as well. Black enrollment dropped during the late 1970s, recovered modestly during the early and mid-1980s, then increased
sharply at the end of the decade. The level of black college enrollment as of the early 1990s is higher than at any other time in history.
Furthermore, the enrollment of blacks rose not only to equality but to more than equality with whites of comparable socioeconomic background and intelligence. As we showed in Chapter 14, the proportion of blacks obtaining college degrees substantially exceeds that of whites, after controlling for IQ. As we have just finished documenting at length, the opportunity for college is also more open to blacks than to whites with equivalent test scores.
Given the goals of affirmative action, it is appropriate to see this increase as a success. We assume as well (we have found no hard data) that affirmative action has also increased the sense among minority youths that college is an option for them and increased the number of college-educated minority role models for minority youths. Still other benefits claimed for affirmative action—helping jump-start advances in the next generation of minority groups or improving race relations—are yet in the realm of speculation.
The costs of affirmative action have been measured in different ways.
31
Relatively little of this commentary has involved the costs to whites. There are such costs—some number of white students are denied places at universities they could otherwise have won, because of affirmative action.
32
But most of the concern about affirmative action comes down to this question: How much harm is done to minority self-esteem, to white perceptions of minorities, and ultimately to ethnic relations by a system that puts academically less able minority students side by side with students who are more able? There are no hard-and-fast answers, but at least we can discuss the magnitude of the problem from the student’s eye view and from the vantage point of the general population.
Getting to know students from different backgrounds is a proper part of a college education. But given the differences in the cognitive abilities of the students in different groups, diversity has other consequences. To the extent that the groups have different scores, both perceptions and grades will track with them. Consider once again the probability of
reaching college for students at different levels of cognitive ability. Comparatively small proportions of students with low intelligence get to college, no matter what their race. But the student on the ground does not see the entire population of students with IQs in the bottom quartile (let us say). Rather, the only people in the bottom quartile whom he sees are the ones who reached college.
To see just how different these perspectives can be, let us take first the extreme “above the battle” view of racial tensions that might be caused by affirmative action. The argument goes as follows:
Yes, there is a racial discrepancy in test scores, though one should interpret those differences cautiously no matter what the evidence on cultural bias may be. But in reality we are talking about small numbers and small differences. In the NLSY data, blacks in the bottom quartile of cognitive ability who reach four-year colleges amount to less than 4 percent of the youths on those campuses, while whites amount to almost 2 percent. Can anyone seriously think that this trivial difference can be a major problem?
The answer seems as if it is self-evidently no. But now we switch to the view from ground level: from the vantage point of the college student who attends classes, listens to fellow students talk in class, observes what is going on in the library and the labs, and gossips with friends about other students. Let us imagine three observations of the kind that students commonly make in the normal course of campus life: the racial mix of the entire student population, the students who stand out because they seem to be especially out of place in a university, and the students who stand out because they seem to be especially smart.
We will operationalize this student’s campus view by looking at the NLSY subjects who attended a four-year university (excluding historically black schools), focusing on those with IQs that put them in the top and bottom 10 percent of such students. The figure below displays what our hypothetical student sees. It shows students by IQ, but a figure that contained the same breakdown by college grades (unavailable in the NLSY) would show roughly the same pattern. Backed up by the many studies that have examined the relationship between cognitive test scores (especially SAT scores) and performance in college: Cognitive test scores generally
overpredict
college grade point average (GPA) for both blacks and Latinos, in comparison to whites.
33
If anything, a figure showing students with the top and bottom 10 percent of GPAs would show an even greater ethnic discrepancy in college performance
between whites and blacks or Latinos than the discrepancy in IQs indicates.
34
Similarly, the data from individual colleges that opened the chapter suggest that this aggregate national picture would look no better, and might well look worse, in a school-by-school portrait.
The student’s eye view of cognitive ability
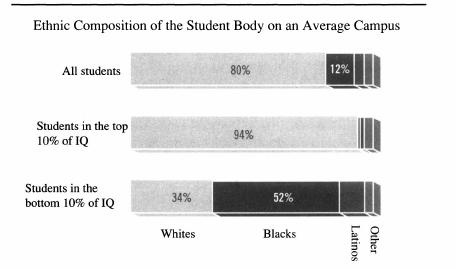
Such large differences in performance are obvious to all, including other students. The problem, and a major cost of affirmative action, is that while blacks in the NLSY constituted only 12 percent of those who went to college, they were 52 percent of the students in the bottom 10 percent in cognitive ability and an almost invisibly small proportion of the top 10 percent. The statistical difference that was trivial in the view from above the battle has become a large racial discrepancy at ground level. Meanwhile the imbalance between Latinos’ representation in the campus population and in the bottom 10 percent of intelligence is less obvious, while the “other” category (a combination of Asians, Pacific ethnic groups, and American Indians) is proportionately represented in the top and bottom (as a conglomerate—if we split them up, most of those in the top are Asian). We suggest that the figure presented above is important in trying to understand some of the most difficult racial problems besetting America’s universities.
R
ACIAL
A
NIMOSITY.
Racial clashes on campuses began to surface in the early 1980s and apparently have been growing since then, with the great bulk of the difficulties between whites and blacks.
35
A plausible explanation
is that whites resent blacks, who are in fact getting a large edge in the admissions process and often in scholarship assistance and many of whom, as whites look around their own campus and others, “don’t belong there” academically. Some whites begin to act out these resentments. Blacks perceive the same disproportions and resentments, then conclude that the college environment is hostile to them.
We will not pursue this line of argument. Rather, we refer our readers to a growing literature by black scholars who have couched it in the context of their own experience.
36
It is plain that affirmative action fosters differences in the distribution of academic ability across races in the communities on college campuses. Students are not imagining these differences.
