The Disaster Profiteers: How Natural Disasters Make the Rich Richer and the Poor Even Poorer (7 page)
Authors: John C. Mutter
Tags: #Non-Fiction, #Sociology, #Urban, #Disasters & Disaster Relief, #Science, #Environmental Science, #Architecture

The general implication (of our flawed measuring of disaster effects) for the socioeconomic consequences of natural disasters is fairly clear. Disasters mainly cause a rapid loss of lives (human capital) and a loss of physical capital stocksâbuilt assets or crops in case of drought and floodsâbut that may have little or no effect on GDP because they are not explicitly included in the GDP formula. They would be seen in GDP only in places where the marginal return to capital is high, and hence a marginal loss of capital would cause a
strong negative return. Rebuilding following a disaster, in contrast, can involve at least the first three components of GDP in a very positive wayâprivate consumption, gross investments, and government spending. It isn't hard to see how the effects of a disaster could also be well hidden in GDP figuresâor, perhaps worse, may be seen in GDP in some countries and not others, depending on the constituents of the economy. And it wouldn't be totally surprising if GDP were to
rise
as the result of a disaster in some settings, but that increase would be meaningless from the viewpoint of social progress.
So how can we think about how disaster losses affect the rich and the poor? Technical Appendix I presents a series of diagrams and some logic that might help explain, in a simplified way, how disaster loss and recovery possibilities can be conceptualized. Technical Appendix II presents some of the basics of so-called neoclassical growth theory that economics has relied on for decades, with suggestions about how disasters might be viewed in that framework.
According to neoclassical growth theory, as an economy starts to grow, at first there is a rapid gain in human welfare from year to year, and then that gain eventually flattens out. Very mature economies, such as those in the United States and Europe, are in the flattened, slow-growth phase. They have a large stock of wealth, but it is not growing very rapidly. China and India are the poster-child twins of high growth; Japan and Argentina may not be growing at all.
This implies that very poor economies should be growing rapidly, yet there are many instances in which they simply are not. Something must be wrong with the theory's treatment of the early stages of growth, even if it properly predicts the later stages. What might more realistically be happening at the start is what is called negative growth, a phenomenon described as a poverty trap.
Here is the classic description of a poverty trap:
- If you live in a poor country, you are very likely to get sickâdue to poor sanitation, lack of health care, and the like.
- But if you are sick, you can't work or go to schoolâyou can't earn, and you can't learn.
- So you get poorer. The poorer you get, the more likely you are to get sick. And so on.
The poverty trap is a self-amplifying feedback of bad consequences.
A country locked in this situation can do nothing to cause growth. In particular, additions of capital are ineffective in promoting growth because the economy isn't capable of making effective use of the capital. Haiti is a good example of this problem.
It also raises an interesting and unexpected factor in thinking about the economic consequences of disasters. If
additions
of capital are ineffective in promoting growth for poverty-trapped economies, then rapid
subtractions
of capital, as might be caused by a natural disaster, may have limited measurable impact as well, especially if GDP is the measure. If the economy is dead, it can't be made more dead. This leads to what has been called a vulnerability paradox: even though you might think, using very good System 1 reasoning, that poor countries are more vulnerable to the impacts of disasters than rich ones, they may in fact not be.
It also says that for very wealthy economies where growth is slow but absolute levels of capital wealth are high, the loss of capital may not be very damaging because the loss represents only a small proportion of the total value of the economy. This might be why the impact of Superstorm Sandy was fairly minor. New York's economy is hugely driven by service-sector activities, which barely lost pace for a moment.
Likewise, some individuals have large capital reserves, and others do not. For that reason, individuals will be able to manage quite differently. The owners of capital are better off than those who don't
own it, even though most disasters are primarily events that cause loss of capital.
Imagine that an economy is halfway between rich and poorâsay, India or Brazil. At a certain time in the history of a country's development, the economy has just managed to get out of poverty and is racing toward prosperity. At this stage, returns to capital are very high. Typically such economies are moving along at full capacity but with no reserves to fall back on in times of crisis. If a disaster happens at this stage, losses of capital could be very consequential. It is not hard to imagine such an economy being thrown back into a poverty trap after a disaster. So it could be, contrary to what System 1 thinking might lead you to believe, that robustly growing economies full of promise might be the most vulnerable.
So what does all this tell us?
We can see that the impact of disastersâeconomic and social, short term and long termâcan be extremely difficult to discern. Many factors contribute to, and obscure, any assessment of what disasters actually do, including a natural-enough tendency to focus more on immediate disaster events with their attention-grabbing scenes of destruction (phase 2) than on their denouement, willful political obfuscation, and the disconnect between the approaches of the natural and social sciences that creates a void often filled by scienciness. Overall, however, it's clear that prosperity provides a shield against the worst that nature can do.
On the pathway to prosperity, societies face many barriers. Natural disasters compete with many other challenges, political and economic. Natural disasters probably do more harm to the prospects of poorer countries than to those of richer ones, but so do economic disasters, political crises, incompetent leadership, corruption, conflicts, and public health emergencies. All these crises are more likely to
happen in poor countries and are more difficult to get under control. The Ebola crisis in West Africa is the leading example at the time of this writing. The very poorest countries may not be made poor by disasters, but disasters of all sorts may stand more firmly in the way of progress in poor countries than they do in rich countries.
Most free-market economies work, or are thought to work, because the holders of capital are far better off than those who do not hold capital. Holders of capital don't actually need to work; their capital works for them. The work they do amounts to ensuring that they remain among those with capital and that they can keep acquiring capital. For this reason, being close to the center of power, which may or may not be the government itself, is important because it allows holders of capital to manipulate policy, and hence laws, that will be most favorable to them.
Postdisaster situationsâlike postconflict situations and times when countries are rapidly emerging from autocratic rule and closed markets (Myanmar and Cuba)âare fertile ground for some and wastelands for others. An elite few make out-of-sight decisions about rebuilding or not rebuilding, about who will benefit from the lucrative contracts that will be part of any reconstruction and who will not. But more important still are the actions of another elite group (perhaps with some of the same members as the first), operating outside media scrutiny, to exploit an opportunity to reshape society in order to secure its hold on power and capital. Wealth is clearly a factor in long-term disaster outcomes. So let's now turn to a geographic view of disasters and wealth.
Chapter 2
The Geography of Wealth and Poverty
Knowledge and Natural Disasters
Where do wealthy people live? Where do poor people live? Where in the world are people most productive? Where are people at high risk from natural disasters? Is there any relationship between these different geographies?
The maps of the world shown in figure 2.1 tells us where wealth measured in gross domestic product (GDP) is generated. Most ways in which the wealth of countries is compared is in the form of tables and graphs. This depiction of the geography of wealth gives a sense of where people are wealthy and where they are poor rather than simply who is wealthy and who is poor. An earlier version of the map at lower resolution was first published by Jeff Sachs and colleagues in 1999.
1
Figure 2.1
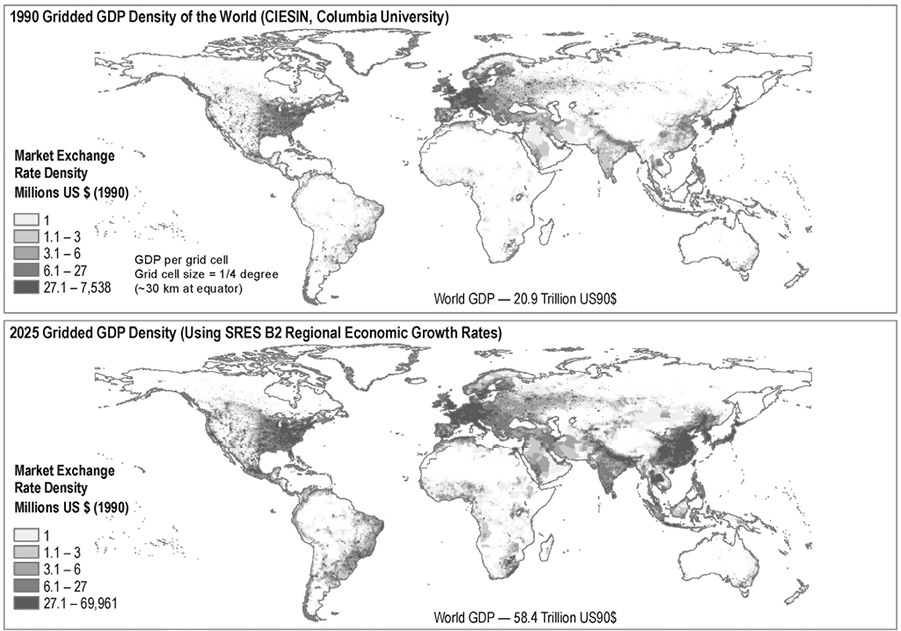
Source: Columbia University Center for International Earth Science Information Network (CEISIN), a NASA Socioeconomic Data and Applications Center | SEDAC.
Some regions are obviously very high producers of GDP; some are very low. Coastal regions are often more wealthy than interior regions. There seem to be oases of prosperity amid economic deserts.
Some of the economic deserts are true deserts (or mountainous dense forests or frozen places) where few people live, but many are not. What these maps make clear is that the geographic distribution of wealth is tremendously uneven, both worldwide and within many countries. Economists know this but seldom portray the distribution of wealth in this manner.
Economists Jeffrey D. Sachs and William D. Nordhaus and their colleagues compiled these data and asked whether something as straightforward as latitude is a factor in determining wealth. They found something surprisingâalthough there is no “Global South,” a term that is in common use to mean the poor countries to the south of Europe, there is a global middle. With few exceptions, the poorest places on Earth lie closest to the equator, and the most productive parts on Earth are in the temperate zones north
and
south of the equator. Other economists, most notably Daron Acemoglu, have suggested that latitude has nothing at all to do with it; what matters are institutions, and the apparent geographic effect is just that, apparent or happenstance.
2
It is striking nonetheless that the most advanced countries are, for the most part, located in regions with fairly benign climates.
Another way to look at the geographic distribution of wealth is with night lights dataâcomposite satellite images that show how Earth is lit up by light sources, as shown in figure 2.2.
3
Figure 2.2
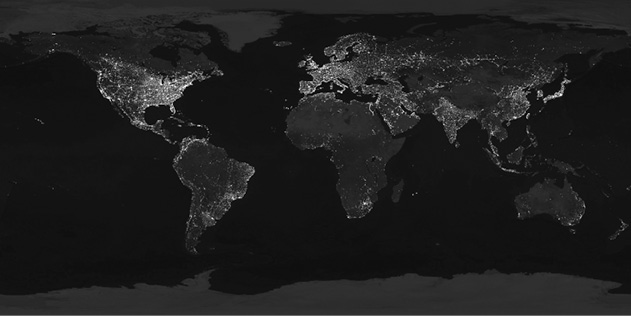
“Night Lights 2012,” a NASA night lights image that illustrates the geographic distribution of wealth across the globe.
Source: NASA Goddard Institute for Space Sciences (GISS).
The most brightly lit places are the places of greatest wealth and correspond fairly well to the first map. Poor regions are dark. Economists are starting to use these data to give information on economic growth patterns, especially in poorer places where standard economic data are hard to come by and not especially reliable. It is far more spatially detailed than a countrywide figure like annual GDP growth.
Figure 2.3 is a night lights image of the Korean peninsula, the kind commonly used to display the stark difference in wealth between two geographically adjacent countries. The one tiny spot of light in North Korea is Pyongyang, the capital. On this map, with its finer level of resolution than that of figure 2.2, we can pick out cities and thin bands of light that show development along major roadways. A comparison between Haiti and the Dominican Republic or between Israel and Palestine is similarly (but not quite as) stark.
Figure 2.3
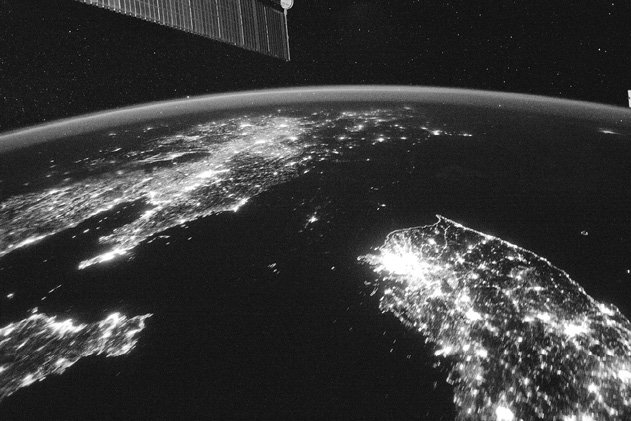
“The Koreas at Night,” a NASA satellite image of North and South Korea, taken January 30, 2014. Pyongyang is the small, bright dot in the center of the image.
Source: NASA Earth Observatory.
You can't hide economic activity from night light observations, unless it is performed underground. Night lights are blind to the difference between, say, formal and informal sectors of an economy, and they show everything that is going on that produces lights. In analyzing such data, you have to be sure you are not including forest fires and other sources of light that do not reflect economic productivity, and you must recognize that agricultural lands are not going to produce much light. When assessments are controlled for such factors, night lights provide a proxy economic output statement that does not
rely on country reports with all the biases and differing standards that are inherent in them.
These maps give part of the answer to this chapter's opening question: Where do rich and poor people live? Although the maps are ways to represent where GDP wealth is produced, that does not imply that the average person living in a region that produces a lot of wealth is wealthy. The reverse is also true. Some very wealthy people live in very poor places. In most countries, no matter how poor the people are in an aggregate sense, there are rich people around.
GDP and night lights maps are proxies for many types of activities.
4
The most brightly lit places typically are also cultural centers, places where theater and the arts thrive. And, importantly, for the purpose of our inquiry, the most brightly lit regions are, by and large, the
places where science is produced. Science and wealth go more or less hand in hand. The National Science Foundation requested $7.255 billion from the US Congress for 2015. Most of the science funded by the NSF has little, if any, direct connection to social needs. A connection may come in the very long term or not at all, but immediate application to the welfare needs of US citizens is not required for a project to be funded. This is especially true of most fundamental forms of science, such as the search for the Higgs boson, which involves the use of a massively expensive apparatus. Our lives are not going to change very much because the Higgs boson has been confirmed or because a vehicle has landed on a comet.
No poor country has the luxury of resources to do this kind of research, and committing funds to such efforts would be an insanely wrong priority relative to other pressing needs. Many poor countries have no institutional science structure at all. Some have remnants from what was begun under colonial powers. A few of those have maintained a reasonable presence in higher education, but most have nothing resembling the research programs of wealthy countries. Where poorer nations have developed a capability in scientific research, it typically is focused on immediate needs. Agricultural research to improve crop yields in water-stressed areas is a good example.
Now look at the map in figure 2.4 of earthquakes of magnitude greater than 4.5 since 1973.
Figure 2.4
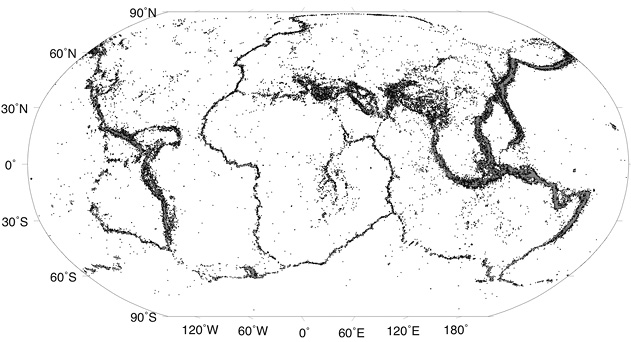
A map highlighting all the occurrences of earthquakes that exceeded a magnitude of 4.5 since 1973.
Source: US Geological Survey.
This map is formed of numerous small dots, one for every earthquake that occurred within the last 30 years with a magnitude greater than 4.5 on the Richter scale.
5
Like wealth, the distribution of earthquakes is far from even but in a different way. Earthquakes occur in fairly tight bands or long smudges rather than in islands of intense seismic activity, and large regions of the planet are more or less free
of earthquakes. The map shows how seismologists see the world, as a filigree of seismic disturbances that originate deep within Earth and pay no attention to human societies and how they might choose to divide up the world. In fact, the map shows none of the usual outlines of continents or countries. It represents how Earth is figured, or disfigured, by earthquakes, not by humans.
The bands of earthquakes occur at tectonic plate boundaries, and their configuration on Earth today reflects the location of those boundaries right now. The boundaries shift very slowly.
6
A map like this drawn 50 million years ago would look quite different, but one drawn 5 million years ago would look very much the same. Earthquakes will continue to occur where they do now for millions of years to come. Night lights maps or GDP density maps for 1900 would have looked much different from those of today, and they will be vastly different in the future.
Figure 2.5 is another geophysical map, this one showing the tracks of tropical cyclones (also called hurricanes and typhoons depending on the region).
7
Figure 2.5
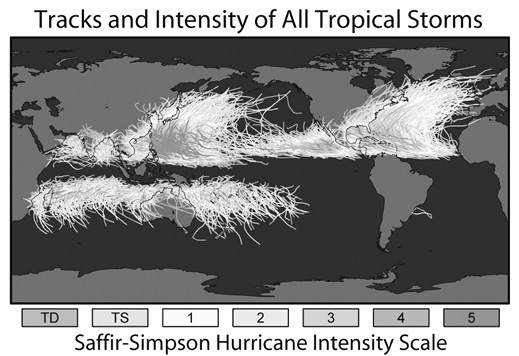
Gray-scaled version of a plot where colors indicate hurricane intensity.
Source: NASA.
Tropical cyclones also have a very distinct distribution, with regions of intense activity and others completely free of cyclones, but the distribution is utterly different from that of earthquakes because the forces that give rise to earthquakes have no connection to those that produce cyclones. Earthquakes originate from forces caused by ultraslow movement of the deep mantle within the solid Earth, while cyclones are the product of atmospheric disturbances. Although the pattern of earthquakes will change only very slowly because the forces that drive them are very slow, significant changes are anticipated in the magnitude spectrum of strong storms (how many cyclones will be of a particular strength each year) and their geographic range as climate change alters temperatures and thus the atmospheric temperature gradients that drive these phenomena. One way to think about
the effects of climate change is to recognize that it implies an expansion of the tropics that could mean extensions both north and south to the range of tropical cyclones and tropical diseases. Because of this extension, cyclones may become common in places where previously they were rare or unknown. New York may experience a Sandy-like storm every few decades rather than once a century. Brazil, currently spared the wrath of hurricanes, may begin to experience them.