The Origins of the British: The New Prehistory of Britain (64 page)
Read The Origins of the British: The New Prehistory of Britain Online
Authors: Oppenheimer

So, with improved dating, the non-recombining Y-chromosome (NRY) method may have the potential for a much greater power of geographical resolution than mtDNA, for both the recent and the distant past. This is simply because the NRY is much larger than mtDNA and consequently has more potential for variation. NRY also has much more geographical resolution in Europe. A major reason for this is thought to be that women have tended to join to the clan of their husbands, rather than the other way round (see below).
Y-chromosome analysis has already helped to chart a genetic trail parallel to the mtDNA trail. At the major geographical branch points, such as the single exit from Africa, they support the story told by mtDNA: they point to a shared ancestor in Africa for all modern humans, and a more recent ancestor in Asia for all non-Africans. In addition, because men’s behaviour differs in certain key ways from women’s, the story told by the Adam genes adds interesting detail. One difference is that men have shown more variation in the number of their offspring than women: a few men father considerably more children than the rest. Women, in contrast, tend to show less variation in the number of children they have. The main effect of this is that most male lines become extinct more rapidly than female lines, leaving a few dominant male genetic lines. This is an example of genetic drift, and could be another reason why the Y-chromosome has more local geographical detail and specificity than mtDNA.
Another difference between the sexes is in movement from place to place. It has often been argued that because women have usually moved to their husband’s village, their genes are inevitably more mobile. Paradoxically, while this may be true within any one cultural region, it results in rapid mixing and dispersal of mtDNA only within that cultural region. For travel
between
regions (or long-distance intercontinental migrations, e.g. in the Pacific) the burden of caring for children would have limited female mobility. Predatory raiding groups would also have been more commonly male-dominated, resulting in increased mobility in the Y-chromosome.
A final point on the methods of genetic tracking of migrations: it is important to distinguish this new approach to tracing the history of molecules on a DNA tree, known as phylogeography (literally ‘tree-geography’), from the statistical study of the history of whole human populations, which has been used for decades and is now known as classical population genetics. (An example of a classical method is Principal Components Analysis, described in
Chapters 6
and
11
.) The two disciplines are based on the same Mendelian biological principles, but have quite different aims and assumptions, and the difference is the source of much misunderstanding and controversy. The simplest way of explaining it is that phylogeography studies the prehistory of individual DNA molecules, while population genetics studies the prehistory of populations. Put another way, each human population contains multiple versions of any particular DNA molecule, each with its own history and different origin. Although these two approaches to human prehistory cannot represent exactly the same thing, their shared aim is to trace
human migrations. Tracing the individual molecules we carry is just much easier than trying to follow whole groups.
In this book I refer to maternal or paternal clans, gene lines, lineages, genetic groups/branches and even haplogroups (gene groups and sub-groups). All these terms mean much the same thing: membership of a large group of genetic types, unambiguously sharing a common ancestor with the same identifying neutral mutation (usually through their mtDNA or Y chromosome). The size of the group is to a certain extent arbitrary and depends on how far back the base of the branch is on the genetic tree. Additionally I use the term ‘gene cluster’ in the context of my own analysis, which splits up the major Y gene groups in Europe into smaller clusters. This is because there is potential for ambiguity in the multiple mutations defining those younger clusters (I enlarge on this in Appendix C).
One thing that quickly becomes apparent from a study of genetic trees is the lack of uniformity in the names attached to these branches. For the Y chromosome in particular, each new scientific paper has, in the past, proposed a new system of scientific nomenclature based on ‘in-house’ genetic markers used by a particular research laboratory. This can make comparison between different studies tedious and repeatedly tests the limits of the reader’s memory. The underlying tree, however, is more or less the same from lab to lab. Recently, a consensus Y nomenclature was published which uses letters from A to R for the main genetic branches (called ‘gene groups’ in this book) in the tree.
5
I use this nomenclature as far as possible in my referencing and figures. The trouble is that even these eighteen
letters and their location on the tree are difficult to hold in the mind – at least in mine.
Luckily, our memory is often aided by context and association. For this reason, and this reason alone, I have introduced nicknames for the major branches and for other branches I refer to frequently. For the larger and more frequently mentioned European gene groups and clusters, I have used personal names as nicknames. In each case I have chosen a name from the appropriate region of origin or highest frequency, which starts with the first letter of the technical name (i.e. from the consensus scientific nomenclature). So, for example, the male gene group R1a1, which is strongly associated with the Ukraine, I have called ‘Rostov’. I have also retained some alliterative and biblical names from my previous book,
Out of Eden
, such as the out-of-Africa Y-line founder Adam and his three descendent lines, Cain, Abel and Seth. There is no intention in adopting such names to infer any deeper meaning – they are simply aides-mémoires.
The mtDNA picture is slightly easier. Many of the different labs agreed at an early stage to try to use a single nomenclature (perhaps there was less testosterone involved in the process!). For instance, there are two agreed non-African daughter and granddaughter lines relevant to the colonization of Europe and Western Eurasia in general: N, from the single out-of-Africa line L3, and her daughter R. In
Out of Eden
I called them Nasreen, in keeping with a southern Arabian origin, and Rohani, to be consistent with an Indian subcontinental origin. I have retained that practice in the genetic trees in Appendices B and C.
UR MATERNAL ANCESTORS: AN OVERVIEW OF THE
E
UROPEAN GENE TREE
In this book I have referred extensively to genetic tracking using maternally transmitted mitochondrial DNA (mtDNA). I have mentioned a number of mtDNA gene groups as having arrived in the British Isles and elsewhere in Northern Europe variously from an Ice Age refuge around the Basque Country (Helina, haplogroup H; Vera, haplogroup V; and U5b1b), from the Near East (J, T and K) and even possibly from Scythia (N1a). I have also given estimated dates for the spread of these gene groups and their descendants after the Ice Age. Without ancestry and context, they become mere names and letters. But of course they do have ancestry: they all belong to the genetic tree of West Eurasian lineages and ultimately arrived from Africa via South Asia.
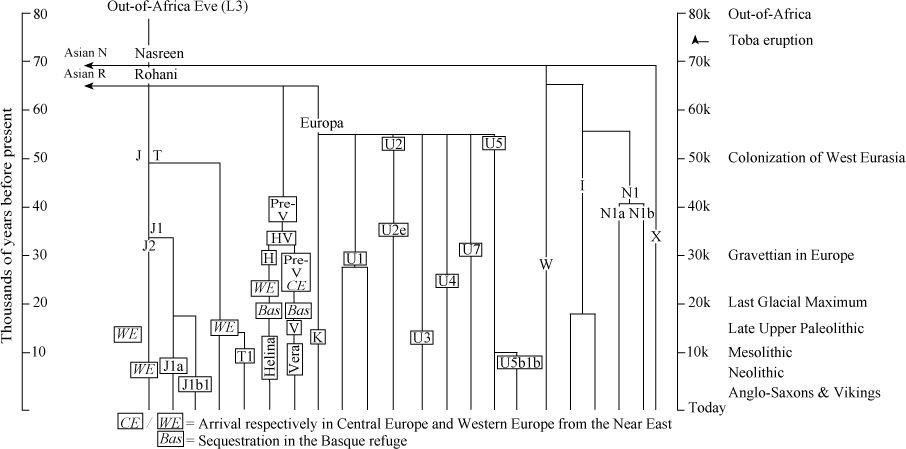
Figure A1
Tree of the main maternal gene groups (haplogroups) used in the analysis in this book in the broader context of the West Eurasian mitochondrial DNA tree. The ancestry of the major Western European group HV and of Europa go back in Europe to pre-glacial times. Helina (detail in
Figure A2
) and Vera diverged before the Ice Age, arriving in the Basque/Iberian refuge from farther east before the freeze. Along with minority groups such as U5b1b, they made up the major re-expansions after the LGM. Groups such as J, T and K expanded into Europe from the Near East after the Ice Age during the Mesolithic and Neolithic.
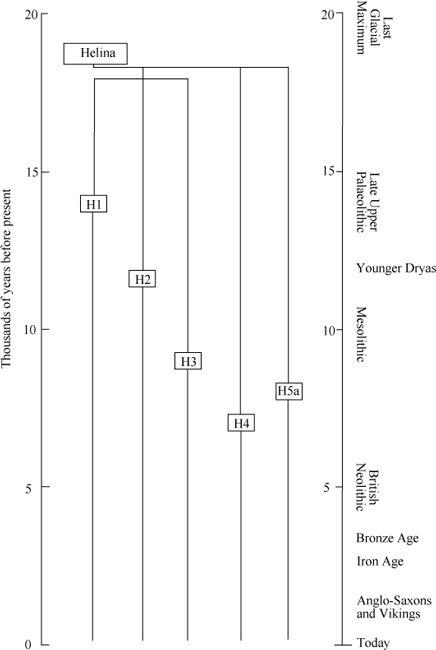
Figure A2
Detail of dated branches of Helina expanding from the Iberian refuge. H1 re-expanded during the Late Upper Palaeolithic, and H2-H5 during the Mesolithic.
In
Figure A1
I update the West Eurasian mtDNA tree from an earlier version
6
to give an overview of that context for the past 50,000 years of European prehistory.
7
How and when they arrived via the Near East and the Trans-Caucasus is described elsewhere.
8
Helina and Vera, the most important mtDNA lines in Western Europe, had their own ancestry, arriving from farther east in Europe,
9
just before settling in for the Ice Age in the south-west Franco-Spanish refuges.
After the Ice Age, Helina expanded from those refuges by splitting into perhaps more than a dozen daughter branches or sub-groups. Several of the larger H sub-groups can be dated in Western Europe.
10
These dates are consistent with the view that Helina’s expansion was divided by the Younger Dryas freeze-up into an immediate phase after the LGM and during the Late Upper Palaeolithic, and another during the Mesolithic immediately after the Younger Dryas (
Figure A2
).
ATERNAL TREES OF ANCESTRY IN
E
UROPE
The Y-chromosome is transmitted from father to son, and, being larger than mitochondrial DNA, has potentially far greater power to chart ancient migrations in time and place. For reasons discussed in Appendix A, it has also far greater geographical specificity and resolution. In the British Isles, the mix of Y gene types varies even from county to county.
A huge collection of Y gene type datasets from the British Isles and its Continental neighbours has been published over the past few years. I have pooled the data, available in the public domain (listed in notes 39–42 and 44 to
Chapter 3
) into a composite dataset of 3,084 individually analysed samples. Most
of the analyses in these publications share the common mutational markers, so-called unique event polymorphisms (UEPs), which allow an unambiguous genetic tree of gene groups to be constructed for combined data. By far the largest body of data in the composite British Isles dataset (85%) was collected by Christian Capelli and colleagues from stable populations in a systematic grid of the region.
11
Their analysis, by a short margin, also uses the largest number of UEPs. The tree they can construct for this is shown in
Figure A3
, with UEPs (e.g. M17) shown on the branches.
12
This tree identifies eleven gene groups, of which all but one (N3) occur in the British Isles. The commonest male gene groups which have entered are, in order, Ruisko (73%: 1,511/2,082), Ivan (16%: 336/2,082),
13
Rostov (6%: 126/2,082), E3b (2%: 47/2,082) and J (2%: 38/2,082). These gene groups are likely to have entered the British Isles piecemeal at different times and by different routes. So if the overall male colonization of the British Isles is to be understood and differentiated from historical speculation of Anglo-Saxon or Celtic invasions, it is important to try to break up the larger gene groups into smaller branches, and to date those branches.