The Origins of the British: The New Prehistory of Britain (30 page)
Read The Origins of the British: The New Prehistory of Britain Online
Authors: Oppenheimer

A third J subgroup, J1b1-16192,
31
characterizes British populations, especially of Scotland and other non-English areas. The distribution of the immediate J1b1 ancestor (without the 16192 mutation) in the rest of Europe is diffuse, although it is rare in non-Scandinavian Germanic-speaking areas and probably ultimately originated via Iberia in the Neolithic. J1b1-16192 is called ‘British Celtic’
32
by Forster on the basis of its British distribution. The problem is that this label does not really explain its significant presence in Norway and Iceland (2.6% and 3%). The highest frequency of J1b1 including the British 16192 marker is in mainland Scotland at 5.6% (5.4% in Wales and 3% in Cornwall). The simplest interpretation is that this subgroup came into Scotland from Norway (
Figure 5.3b
),
33
and its presence in Iceland is presumably derived either from Britain or, more likely, Norway (see
Chapter 12
).
34
Any thoughts that this British J1b1 Neolithic maternal type might just be a more recent Viking female Valkyrie intruder can be discounted, since her even distribution in Wales and Cornwall is not consistent with a Viking origin. In any case, Forster dates the 16192 mutation expansion in Britain to at least 4,000 years ago. That is the age it would be if the 16192 mutation originated in Britain and then spread to Norway and Iceland; but if, as seems geographically more logical, she originated in Norway, then the calculation is different and entry was possibly as long ago as 6,000 years. So, the default explanation based on the Norwegian match is that this ‘British’ J1b1 type may have arrived in Britain via northern Scandinavia, either
during the Late Mesolithic or when the Neolithic finally reached Norway around 6,000 years ago.
35
The J1b1 distribution in northern Britain is similar to those of male clusters from Scandinavia: I1a-5 and the much more common R1a1-2, dating to the Neolithic.
36
The latter are Neolithic entrants, also deriving from Norway rather than the Anglo-Saxon homeland, and are present throughout Britain, reaching rates in northern Scotland and its offshore islands of 5– 14% (Figure 5.6a).
37
The alternative suggestion that J1b1-16192 is a Celtic marker is unsupported (even to the most orthodox adherent of the Iron Age Central European Celtic homeland),
38
based on its distribution and the Norwegian connection.
Here is a partial solution to the puzzling recurrent hints of a pre-Roman, pre-Viking, Neolithic Norse connection favouring northern and eastern Britain. As we saw in
Chapter 1
, Tacitus made an ethnic comment about Scottish and Scandinavian redheads, a feature which is still with us today and now has a genetic explanation.
39
Then there is the issue of the origins of the Picts and of Bede’s tale of their putative origins in Scythia, distinctive prehistoric culture and Scandinavian ponies, which could find a solution with this third J branch. There was also Avenius’ confusing précis of Himilco’s sixth-century
BC
exploration of Britain (see
Chapter 1
), in which he tells us darkly that the original inhabitants of the freezing north had previously been chased off the coast (presumably in this case the west coast of Scotland) by the Celts and had taken refuge in the hills.
The rest of the immigrant maternal lines from the Near East into Europe belong to branches T1, U3, a few sub-clusters of Helina (H) and W (another minority West Eurasian subgroup). Except for T1, these do not help us much further with specific
routes since they are found on both the southern and northern trails, and U3 does not seem to have made it to England virtually at all, although present at low rates in Scotland and Ireland. Group T and subgroup T1 are more common in Northern and Eastern Europe generally. T1 dates to about 6,500 years ago among Germanic-speaking populations
40
and, like J1b1, also features among Scots, but not farther south in eastern Britain (e.g. not in East Anglia).
41
Like the British J1b1 Neolithic maternal type, T1 may have arrived directly across the North Sea from Scandinavia during the Neolithic, rather than later.
The landmark analysis of spread of maternal lines into Europe carried out by Martin Richards and his colleagues and completed in 2000 looked specifically at immigration across the Bosporus threshold from the Near East. While this was the best overall way of plotting the prehistory of various Neolithic immigrations into the European ‘peninsula’ from the Near East, it could not identify all Neolithic expansions and migrations of indigenous European lines moving
within
Europe.
This analytical problem specifically affects the measurement of how much of the Neolithic migrations were from the Near East and how much was acculturation of indigenous Mesolithic peoples and of re-expansions from the old Ice Age refuges retracing well-worn routes.
42
Richards pointed out that the Near Eastern Neolithic gene lines bypassed the old Basque Ice Age refuge.
43
While the evidence from invading Near Eastern maternal gene lines gives some indication of the relative lack of effect on the north-western Atlantic fringe, it does help to highlight the large flow of indigenous maternal gene lines north up the Atlantic coast to the British Isles during the Late Mesolithic (
Figure 4.4
).
44
The problem of differentiating immigrant farming lines from the Near East from Neolithic expansion and migration of local European populations across Europe may actually be greater for the LBK-marked expansion from south-east to north-west, since the cultural (i.e. as revealed archaeologically) expansion of LBK clearly took place within Central Europe as a secondary event after the start of the Balkan Neolithic.
In summary, if there were better resolution of maternal lines we might be able to add more endogenous European lines to that 22% of Neolithic immigration to north-west Europe. A more recent figure puts the Neolithic immigration of gene groups J, T1 and U3 to Ireland at only 13%, ‘a value that is toward the lower end of the range, found in Europe and similar to areas such as Scandinavia and the western Mediterranean (Iberia).’
45
The lower Irish figure of 13% is consistent with my even lower male Neolithic estimates for Ireland (7%, see
Figure 5.4
), but the figure of 22% for north-west Europe is somewhat low, by this measure (see below). But these percentages relate only to the maternal genes that specifically came from the Near East. What about those lines that arose primarily in the Balkans and moved north and north-west through Germanic countries to the Baltic? Hopefully, other internal maternal Mesolithic migrations will be detected in the future.
The current status of geographic differentiation of maternal lines in Europe may be insufficient to answer all these questions, but in my view there is a potential answer to be found within the Y chromosomal lines. Martin Richards wonders why, when ‘The mtDNA picture … suggests a value of about 20% for Near Eastern lineages in the north-west … By contrast, both classical markers and the Y-chromosome indicate few or
no Neolithic markers in the British Isles.’
46
A solution to this mismatch problem – and more – can, as I have suggested, be supplied by the European Y branch Ivan, which accounts for 20% of English male lines
47
and takes us on conveniently to look at the male signals for the Neolithic spread in Europe.
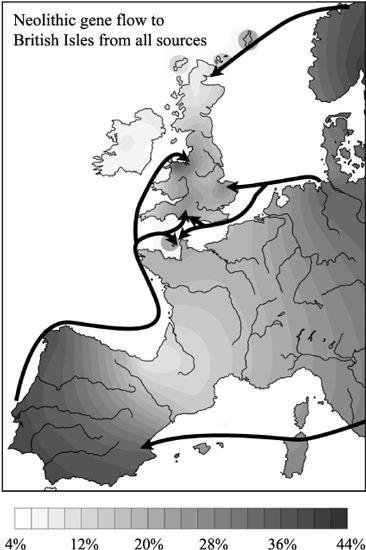
Figure 5.4
How much male Neolithic gene flow was there into the British Isles? Net Neolithic gene flow into England and north Wales matched the nearby Continent, ranging from 16 to 40%. The lowest rates were in Ireland, peninsular Wales, Cornwall and western Scotland, ranging from 5 to 10% (southern lines E3b, I1b*, I1b2 and J and northern lines I1a-4, I1a-5, I1a-2’1b, I1a-7b, I1a-6b, R1a1–1 and R1a1–2a&b).
Figure 5.4
)
Part of the reason why there appear to be relatively fewer male than female candidates for Near Eastern migration to Europe during the Neolithic may be lack of published Y dating, which I aim to address here (as elsewhere in this book). However, the other reason is likely to be disregarded internal European migrations and expansions. The reality may be that there were as many if not more males than females moving during the Neolithic, but mainly within Europe.
In my discussion of Late Upper Palaeolithic and Mesolithic Y-chromosome movements into the British Isles, I mentioned several lines which were likely to have arrived during those earlier periods, but only re-expanded significantly during the Neolithic. These include representatives from both the Iberian and more easterly LGM refuges.
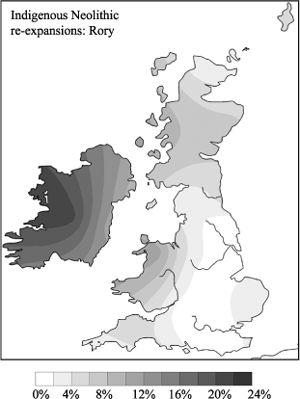
Dealing first with old founders from Iberia, one of the most interesting male clusters of all is Rory (R1b-14). As mentioned in
Chapter 4
, he has a limited distribution, mainly in Ireland and the western British Isles (8% in the British Isles overall
48
). Rory has a particularly Irish flavour and has very small representation in the Iberian refuge populations and mainland Europe. He has an intermediate rate in Britain, being more common in southwest Wales, the Western Isles of Scotland and Orkney. Rory is, however, very common in Ireland, being found in 18% of the east coast and 23% of the west coast samples (
Figure 3.6d
), while his highest rate of 33% was found in a large sample of Irish men with Gaelic names, making him the most common
cluster in that sample. The most common single Rory type, which could be called the ‘Gaelic Modal Haplotype’, constitutes 13% of Gaelic-named men.
49
This specific celtic-surname association was originally though to suggest a later entry of Rory, possibly during the Neolithic.
50
But that is not consistent with the diversity and my date for the founding of the whole Rory cluster, which arrived before the Younger Dryas. After the YD, Rory broke up into three clusters, two expanding in the Late Mesolithic (see
Chapter 4
) and one in the Irish Early Neolithic (
Figure 5.5a
).
51
This alternative scenario, that the Irish Mesolithic and Neolithic were associated with population re-expansions of pre-existing lines, suggests several possible reasons for Rory’s ‘celtic association’. Either celtic languages arrived during the Palaeolithic, or there was a simple regional association within Ireland, or the chief cause of linkage was cultural continuity, irrespective of language. The first possibility is unlikely, and I suspect a combination of the other two.
Moving on to other re-expanding ‘indigenous’ lines, R1b-13 arrived during the Mesolithic (
Figure 4.6
) and subsequently gave rise to two Neolithic clusters, R1b-11 and R1b-12. While both are strongly represented in Wales and Ireland, the Fen country, and along the Atlantic coast of Britain, R1b-11 also characterizes Scotland and the Western Isles, and around Norfolk (
Figure 5.5b
). They jointly account overall for 7% of extant British lines,
52
but most of their diversity developed with Late Neolithic population expansions. Their re-expansion partly explains why the rate of contemporary incoming Neolithic lines on the Atlantic coast of Britain is lower than for eastern Britain and elsewhere in Europe.
5.5a–c
Indigenous re-expanding clusters of the Neolithic.