Understanding Business Accounting For Dummies, 2nd Edition (94 page)
Read Understanding Business Accounting For Dummies, 2nd Edition Online
Authors: Colin Barrow,John A. Tracy
Tags: #Finance, #Business

Recapping the example shown in Figure 12-2: The business manufactured 10,000 more units than it sold during the year. With variable manufacturing costs at £410 per unit, the business took on £4.1 million more in manufacturing costs than it would have if it had produced only the 110,000 units needed for its sales volume. In other words, if the business had produced 10,000 fewer units, its variable manufacturing costs would have been £4.1 million less. That's the nature of variable costs. In contrast, if the company had manufactured 10,000 fewer units, its
fixed
manufacturing costs would not have been any less - that's the nature of fixed costs.
Of its £42 million total fixed manufacturing costs for the year, only £38.5 million ended up in the cost of goods sold expense for the year (£350 burden rate × 110,000 units sold). The other £3.5 million ended up in the stock asset account (£350 burden rate × 10,000 units stock increase). Let us be very clear here: We're not suggesting any hanky-panky. But the business did help its pre-tax profit to the amount of £3.5 million by producing 10,000 more units than it sold. If the business had produced only 110,000 units, equal to its sales volume for the year, then all the fixed manufacturing costs would have gone into cost of goods sold expense. As explained above, the expense would have been £3.5 million higher, and EBIT would have been that much lower.


The actual costs/actual output method and when not to use it
To determine its product cost, the business in the Figure 12-2 example uses the
actual cost/actual output method,
in which you take your actual costs - which may have been higher or lower than the budgeted costs for the year - and divide by the actual output for the year.The actual costs/actual output method is appropriate in most situations. However, this method is not appropriate and would have to be modified in two extreme situations:
Manufacturing costs are grossly excessive or wasteful due to inefficient production operations:
For example, suppose that the business represented in Figure 12-2 had to throw away £1.2 million of raw materials during the year. The £1.2 million is included in the total raw materials cost, but should be removed from the calculation of the raw material cost per unit. Instead, you treat it as a period cost - meaning that you take it directly into expense. Then the cost of goods sold expense would be based on £750 per unit instead of £760, which lowers this expense by £1.1 million (based on the 110,000 units sold). But you still have to record the £1.2 million expense for wasted raw materials, so EBIT would be £100,000 lower.
Suppose that the Figure 12-2 business produced only 75,000 units during the year but still sold 110,000 units because it was working off a large stock carryover from the year before. Then its production capacity would be 50 per cent instead of 80 per cent. In a sense, the business wasted half of its production capacity, and you can argue that half of its fixed manufacturing costs should be charged directly to expense on the profit and loss account and not included in the calculation of product cost.

Now suppose that the business manufactured 150,000 units during the year and increased its stock by 40,000 units. This may be a legitimate move if the business is anticipating a big jump in sales next year. But on the other hand, a stock increase of 40,000 units in a year in which only 110,000 units were sold may be the result of a serious overproduction mistake, and the larger stock may not be needed next year. In any case, Figure 12-3 shows what happens to production costs and - more importantly - what happens to profit at the higher production output level.
The additional 30,000 units (over and above the 120,000 units manufactured by the business in the original example) cost £410 per unit. (The precise cost may be a little higher than £410 per unit because, as you start crowding your production capacity, some variable costs may increase a little.) The business would need about £12.3 million more for the additional 30,000 units of production output:
£410 variable manufacturing cost per unit × 30,000 additional units produced = £12,300,000 additional variable manufacturing costs invested in stock
Again, its fixed manufacturing costs would not have increased, given the nature of fixed costs. Fixed costs stay put until capacity is increased. Sales volume, in this scenario, also remains the same.
But check out the business's EBIT in Figure 12-3: £23.65 million, compared with £15.95 million in Figure 12-2 - a £7.70 million increase, even though sales volume, sales prices, and operating costs all remain the same. Whoa! What's going on here? The simple answer is that the cost of goods sold expense is £7.70 million less than before. But how can cost of goods sold expense be less? The business sells 110,000 units in both scenarios. And, variable manufacturing costs are £410 per unit in both cases.
The burden rate component of product cost in the first case is £350 (see Figure 12-2). In the second case the burden rate is only £280 (see Figure 12-3). Recall that the burden rate is computed by dividing total fixed manufacturing costs for the period by the production output during the period. Dividing by 150,000 units compared with 120,000 units reduces the burden rate from £350 to £280. The £70 lower burden rate multiplied by the 110,000 units sold results in a £7.7 million smaller cost of goods sold expense for the period, and a higher pre-tax profit of the same amount.
Figure 12-3:
Example in which production output greatly exceeds sales volume, thereby boosting profit for the period.
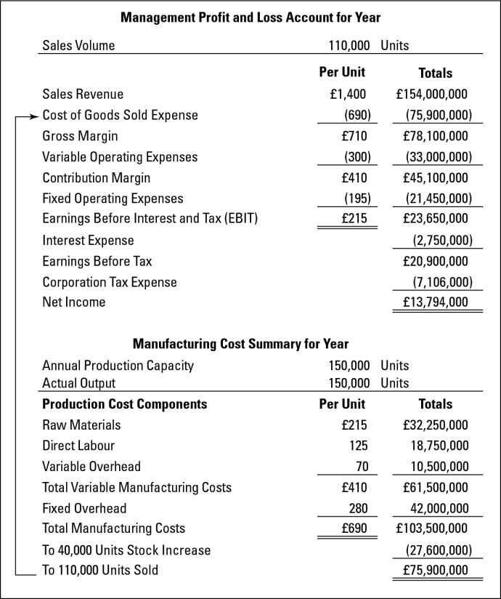
In the first case the business puts £3.5 million of its total annual fixed manufacturing costs into the increase in stock (10,000 units increase × £350 burden rate). In the second case, in which the production output is at capacity, the business puts £11.2 million of its total fixed manufacturing costs into the increase in stock (40,000 units increase × £280 burden rate). Thus, £7.7 million more of its fixed manufacturing costs go into stock rather than cost of goods sold expense. But don't forget that stock increased 40,000 units, which is quite a large increase compared with the annual sales of 110,000 during the year just ended.
Who was responsible for the decision to go full blast and produce up to production capacity? Do the managers really expect sales to jump up enough next period to justify the much larger stock level? If they prove to be right, they'll look brilliant. But if the output level was a mistake and sales do not go up next year, they'll have you-know-what to pay next year, even though profit looks good this year. An experienced business manager knows to be on guard when stock takes such a big jump.