Why the West Rules--For Now (100 page)
Read Why the West Rules--For Now Online
Authors: Ian Morris
Tags: #History, #Modern, #General, #Business & Economics, #International, #Economics

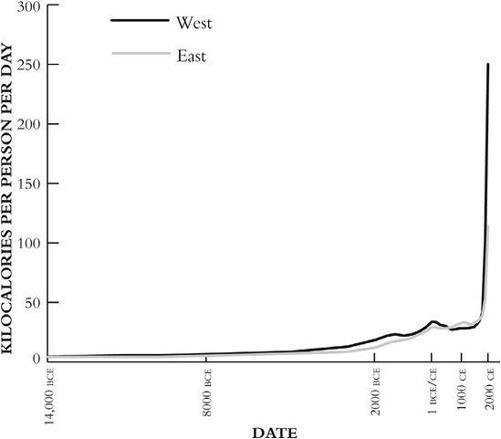
Figure A.1. Energy alone: how East and West compare if we just look at energy capture per person
Another version of objection 3 would drop organization, war-making, and information technology from the analysis and concentrate only on energy capture, on the grounds that organization, war-making, and information technology are merely ways of
using
energy. Figure A.1 shows what an energy-alone index would look like. It is different from the full index graph in
Figure 3.3
, but not hugely so. In the energy-alone graph, just like the full social development graph, the West still leads the East for 90 percent of the time, the East still overtakes it between roughly 550 and 1750
CE,
there is still a hard ceiling that blocks development around 100 and 1100
CE
(at just over 30,000 kilocalories per person per day), postindustrial revolution scores still dwarf those of earlier ages, and in 2000 the West still rules.
Focusing on energy alone has the advantage of being more parsimonious than my four-trait approach to social development, but it also has one great drawback. This is the second large exception to the redundancy rule: the fact that since the industrial revolution the relationship between traits has become nonlinear. Thanks to new technologies, city size quadrupled across the twentieth century, war-making capacity increased fiftyfold, and information technology surged eightyfold, while energy capture per person merely doubled. Looking at energy alone is
too
simple, and distorts the shape of history.
Objection 4 raises very different issues, because the only way to assess whether I have misunderstood the evidence or used inappropriate methods is by reexamining all the sources of information I used to calculate Eastern and Western scores across the last sixteen thousand years. Doing that in this appendix would be an expensive proposition, making an already-long book much longer still, so I have put the information on the website mentioned above. Readers with the time and inclination can find out there precisely what sources I have used and my views on the ambiguities in the evidence.
In what remains of this appendix I will summarize the data, outline quickly how I calculated the scores, and say a few words about margins of error.
ENERGY CAPTURE
I discuss energy capture first and at greatest length because it is quantitatively the most important of the four traits. If we go back far enough in time, the urbanization, war-making, or information-technology scores all fall to zero because human activities were on such a tiny scale that they generate values below 0.01 point on the index. The energy-capture scores by contrast never fall to zero, because humans who capture zero energy die. Keeping body and soul together requires roughly 2,000 kilocalories per capita per day, and since modern Western energy capture is about 228,000 kcal/cap/day (= 250 points), the lowest score possible in theory would be 2.19; and in reality, energy capture has always scored above 4 points since the end of the Ice Age, because much of the energy humans use is in nonfood forms (clothes, shelter, artifacts, fuel, and so on). Until the industrial revolution, the
energy capture score typically accounts for 75–90 percent of the total social development scores. In 2000 it still accounted for 28 percent of the Western and 20 percent of the Eastern scores.
The evidence for energy capture ranges from modern statistical digests to literary accounts of farming, industry, and lifestyles, to archaeological evidence for diet, crafts, and quality of life. Combining such varied materials is a challenge, but here, as elsewhere, I have built on the contributions of earlier researchers. As I explained in
Chapter 3
, Earl Cook’s 1971 study of energy flows provides a convenient starting point that can be constantly checked against other estimates. These all converge on contemporary levels in the Western core of around 230,000 kcal/cap/day, which Cook divides into rough categories of feed/food (for domesticated animals as well as humans), home/commerce, industry/agriculture, and transport.
Vaclav Smil (1991, 1994) usefully breaks nonfood consumption down into biomass and fossil fuels, and graphs their development in the Western core over time. Several steps are needed to turn his data into energy-capture scores for the West, but the results come out around 93,000 kcal/cap/day in 1900 and 38,000 in 1800, neatly bracketing Cook’s estimate of 77,000 for industrialized Europe in 1860.
The further we move back before 1800 the fewer government-generated statistics are available, but the more that economies relied on biomass fuels, the more we can substitute comparative information gathered by economic historians and anthropologists for official documents. In 1700 the average person in the Western core must have consumed somewhere between 30,000 and 35,000 kcal/day. Our evidence for what Western societies did shows clearly that the further we go back into the previous thousand years the lower that number falls,
*
though the comparative evidence also makes it clear that Western energy consumption could never have fallen too far below 30,000 kcal/cap/day. There is room for debate, but I doubt that medieval Western energy capture ever fell below 25,000 kcal/cap/day, even in the eighth century
CE.
For reasons I return to below, I do not see how these guesstimates can be more than 5–10 percent wide of the mark.
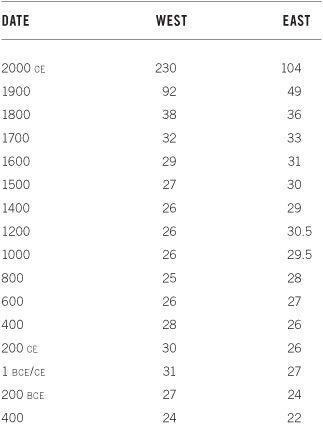
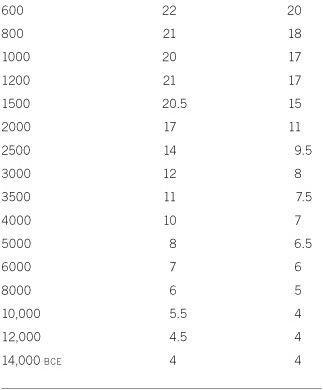
Table A.1. Energy capture, kilocalories/person/day (selected dates)
The impressive ruins of Roman-era houses and monuments, the numbers of shipwrecks, the volume of manufactured goods, the level of industrial pollution in ice cores, and the staggering numbers of animal bones from settlements make it clear that Western energy capture was higher in the first century
CE
than in the eighth or even the thirteenth, but how much higher? Ingenious calculations by economic historians point toward an answer. Robert Allen (2007a) has shown that in 300
CE
real wages (which, for most of the poor in premodern times, closely mirrored energy consumption) in the Western core were comparable to those of southern Europe in the eighteenth century
CE
, and Walter Scheidel (2008) has suggested that Roman-era wages were comfortably higher than those in much of medieval Europe. Data gathered by Geof Kron (2005) and Nikola Koepke and Joerg Baten (2005, 2008) indicate that stature changed little between the first and eighteenth centuries, and Kron (forthcoming) suggests that ancient housing was typically better than that in the richest parts of eighteenth-century Europe. I have estimated energy capture at around 31,000 kcal/person/day in the years 1
BCE/CE,
declining slowly until 500
CE
and then faster until 700.
Energy capture must have been lower in the Western core around 1000
BCE
not only than in Roman times, but also than in the eighth century
CE
. The sharpest period of increase came after 300
BCE,
as the Mediterranean was integrated into larger political and economic units and the Roman Warm Period raised output, but the mass of archaeological data also shows an earlier period of acceleration after 600
BCE.
I have tentatively suggested that in 1000
BCE
energy capture may have been as low as 20,000 kcal/cap/day, a slight decline on the levels of the late second millennium
BCE,
but still above those of the third millennium.
Earlier in prehistory scores were lower still. At the end of the Younger Dryas foragers were probably getting by on about 5,000 kcal/cap/day, but this would have risen sharply (relative to what had gone before) as the climate warmed, plants and animals were domesticated for food, and animals were harnessed for draft power. By 3000
BCE
people in established villages in the Hilly Flanks must have been consuming 12,000 kcal/cap/day for their clothes, fuel, farm animals, houses
and household goods, and monuments, even if their diets were no better than they had been four millennia earlier.
Calculating Eastern scores is more difficult still, partly because scholars such as Cook and Smil were concerned only with the region of the world that had the highest energy capture, not with regional comparisons. We can begin, though, from the United Nations (2006) estimate that in 2000
CE
the average Japanese person consumed 104,000 kilocalories per day (less than half the Western level). In 1900 the Eastern core was still largely agrarian, with Japanese oil use and even coal-powered industry in its infancy. Japanese energy capture may have been around 49,000 kcal/cap/day (again less than half of Western consumption). Across the previous five centuries coal use and agricultural output had risen steadily. In 1600 productivity was higher in the Yangzi Delta than anywhere in the West, but by 1750 Dutch and English agriculture had caught up and Eastern real wages were comparable to those in southern Europe rather than wealthy northern Europe. I have estimated energy capture in the Eastern core around 29,000 kcal/cap/day in 1400 and 36,000 in 1800, with the bulk of the increase coming in the eighteenth century.
There is also debate over how badly the crisis after 1200 impacted Chinese energy use, but there was probably at least a slight dip from the Song-era peak, when consumption probably surpassed 30,000 kcal/cap/day.
As in the West, the archaeological evidence makes it clear that energy capture went through a trough in the mid first millennium
CE
, but again it is difficult to say just how steep the decline was. The evidence I reviewed in
Chapter 5
suggests that Han dynasty energy consumption was higher than anything previously seen in the East but lower than contemporary Roman or later Song levels; I have estimated 27,000 kcal/cap/day in 1
BCE/CE
, returning to the same level by 700
CE
after a slight fall.
Again paralleling the West, Eastern energy capture in the first millennium
BCE
saw steady increases, accelerating after about 500
BCE
and still more after 300
BCE
with the spread of canal networks, trade, and metal tools. Back in 1000
BCE
the average energy capture may have been around 17,000 kcal/cap/day; by the time of the Qin First Emperor it was probably more like 26,000.
In prehistoric times Eastern energy capture seems to have passed through much the same thresholds as Western, but began moving upward later and generally ran one to two millennia behind.
ORGANIZATION
Throughout preindustrial history organization was always the second-largest component in social development scores. I used this trait as my main example in
Chapter 3
, explaining why I use largest city size as a proxy for social organization. There is enough ambiguity in the data and flexibility in definitions that experts disagree over city sizes in every period, and I explain my decisions on the website. In
Table A.2
I just summarize some of my main calculations.