Why the West Rules--For Now (102 page)
Read Why the West Rules--For Now Online
Authors: Ian Morris
Tags: #History, #Modern, #General, #Business & Economics, #International, #Economics

Table A.4. Information technology scores
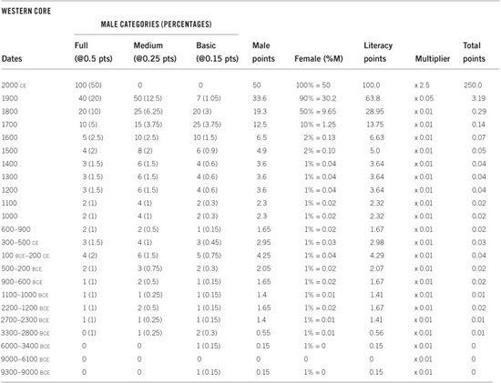
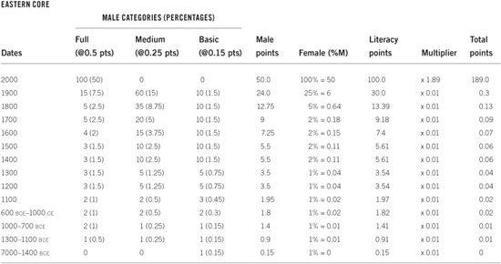
MARGINS OF ERROR
I spoke repeatedly of estimates and guesses in the previous section, because there is no way to build a social development index without them. One consequence of that is that no index will ever be “right,” whether we take that word in the strong sense of meaning that every single detail is completely accurate or in the weaker sense of meaning that all experts will make the same estimates. As a result, there is no point in asking whether the social development scores I have calculated are wrong. Of course they are. The real question is:
How
wrong are they? Are they so wrong that the basic shape of the history of social development as represented in the graphs in
Chapters 4
–10 is misleading, meaning that this whole book is fatally flawed? Or are the errors in fact relatively trivial?
These questions can in principle be answered easily enough; we simply need to ask (1) just how much we would need to change the scores to make the past look so different that the arguments advanced in this book would cease to hold good and (2) whether such changes are plausible.
Ultimately the only way to do this is by examining the evidence listed on the website (
www.ianmorris.org
) for each individual calculation I have made, but here I want to address briefly the possibility that systematic errors undermine my claims about the overall shape of history. According to my index (shown on a log-linear scale in
Figure 3.7
), the West took a lead after 14,000
BCE
. The East slowly caught up, and through most of the first millennium
BCE
the West’s lead was narrow. Around 100
BCE
the West increased its lead, but in 541
CE
the East pulled ahead. It stayed there until 1773. The West then regained the lead, and, if twentieth-century trends continue, will hold it until 2103. Western development has been higher than Eastern for 92.5 percent of the time since the end of the Ice Age.
I suggested in
Chapter 3
that overall my scores could err by as much as 10 percent without significantly altering this pattern.
Figure A.2a
shows how the trends would look if I have consistently underestimated Western development scores by 10 percent and overestimated Eastern scores by the same amount;
Figure A.2b
shows the outcome if I have underestimated Eastern development scores by 10 percent and overestimated Western scores by the same amount.
The first point to note is that these scores severely strain credibility.
Figure A.2a
, raising Western and lowering Eastern scores by 10 percent, requires us to accept that the West was more developed than the East in 1400
CE,
right before Zheng He sailed on the Indian Ocean; it also means that when Hannibal led his elephants to attack Rome in 218
BCE
Western development was already higher than the East’s would be in Zheng’s time. As if that were not peculiar enough, the graph additionally tells us that the West was more developed when Julius Caesar was murdered in 44
BCE
than the East was when China’s emperor Qianlong rejected Lord Macartney’s trade embassy in 1793.
Figure A.2b
is perhaps even more peculiar. The development score it gives to the West in 700
CE
, for instance, when the Arabs ruled a vast caliphate from Damascus, is lower than that for the East in the age of Confucius, which cannot be right; and it would make the Western score in 1800, when the industrial revolution was already under way, lower than the Eastern scores under the Song dynasty in 1000–1200, which seems even less likely.
Yet even if historians could swallow such odd conclusions, the shapes of history as represented in
Figure A.2
are still not different enough from that in
Figure 3.7
to change the basic pattern that needs explaining. Short-term accident theories remain inadequate because even in
Figure A.2b
the West’s score is still higher most of the time (although “most” now means 56 percent rather than 92.5); so, too, long-term lock-in theories, because even in
Figure A.2a
the East does take the lead for seven centuries. Biology and sociology remain the most plausible explanations for the upward but interrupted movement of development, while geography remains the most plausible explanation for why the West rules.
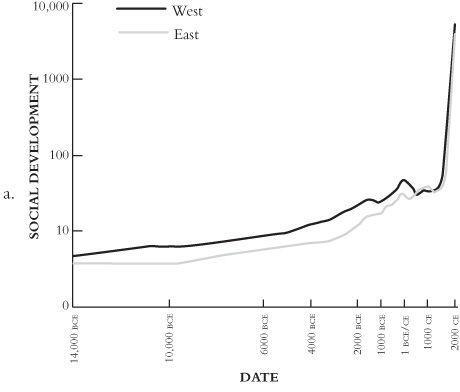
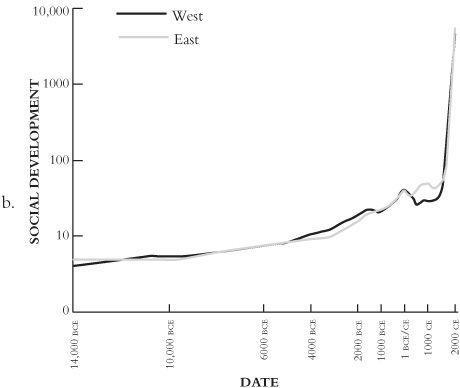
Figure A.2. Error revealed: the implications of systematic errors in social development scores. (a) raises all Western scores by 10 percent and reduces all Eastern scores by the same amount; (b) raises all Eastern scores by 10 percent and reduces all Western scores by the same amount.
To change the fundamental patterns my estimates would need to be 20 percent wide of the mark.
Figure A.3a
shows how history would look if I have consistently underestimated Western development scores by 20 percent and overestimated Eastern scores by the same amount;
Figure A.3b
, the outcome if I have underestimated Eastern development scores by 20 percent and overestimated Western scores by the same amount.
This time the patterns are very different. In
Figure A.3a
the Western score is always higher than the Eastern, making long-term lock-in theories seem very plausible and also invalidating my claim that social development changes the meaning of geography.
Figure A.3b
, by contrast, effectively reverses the conclusions of my actual index, having the East lead 90 percent of the time since the Ice Age.
If either
Figure A.3a
or
A.3b
is correct, everything you have just read in this book is wrong. We can be confident, though, that they are not correct.
Figure A.3a
, raising Western scores and reducing Eastern scores by 20 percent, tells us that imperial Rome’s development in 1
BCE/CE
was only five points behind industrial Japan’s in 1900, which cannot be true; while
Figure A.3b
, raising Eastern scores and reducing Western scores by 20 percent, means that Eastern development was higher in pre-Shang times than Western would be under the Persian Empire; that the West caught up with the East only in 1828, on the eve of the Opium War; and that Western rule has already ended (in 2003). None of this seems credible.
Hence my suggestions in
Chapter 3
that (a) the margin of error in my estimates is probably less than 10 percent and definitely less than 20 percent, and (b), even if the margin of error does rise to 10 percent, the basic historical patterns I am trying to explain still hold good.
CONCLUSION
I observed several times in
Chapter 3
that making a social development index is chainsaw art. The best an index can do is to give us a rough, good-enough approximation that makes the index designer’s assumptions explicit. I have argued that the main reason we have for so long failed to explain why the West rules is that protagonists have defined their terms in different ways and focused on different parts of the problem. The simple act of setting up an index should therefore move the debate forward. Critics of this book who raise the first of the objections I listed at the start of this appendix—that quantitative comparisons are unacceptable because they dehumanize us—will be forced either to find another way to explain why the West rules or to show why we should not be asking that question at all, while critics who raise objections 2 through 4—that I have defined social development badly, used the wrong traits, or misunderstood the evidence—will be forced to come up with better indices of their own. And then, perhaps, we will see some real progress.
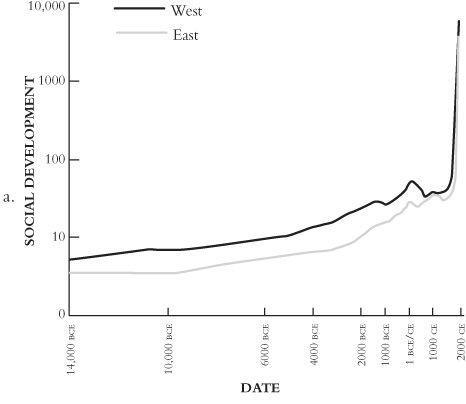
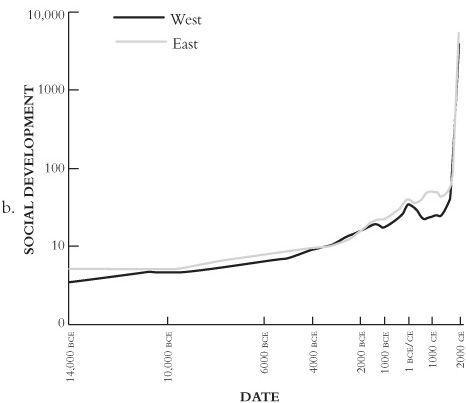
Figure A.3. Even greater error: (a) raises all Western scores and reduces all Eastern scores by 20 percent, and (b) raises all Eastern scores and reduces all Western scores by 20 percent