Alex’s Adventures in Numberland (63 page)
Read Alex’s Adventures in Numberland Online
Authors: Alex Bellos

Strategy 4: Proportional betting
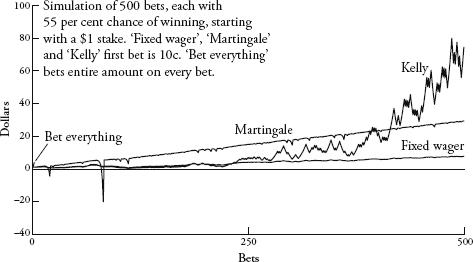
. In this case, bet a fraction of your bankroll related to the edge you have. There are several variations of proportional betting, but the system where wealth grows fastest is called the Kelly strategy. Kelly tells you to bet the f bankr your bankroll determined by. In this case, the edge is 10 percent and the odds are evens (or 1 to 1), making
equal to 10 percent. So, wager 10 percent of the bankroll every bet. If you win, the bankroll will increase by 10 percent, so the next wager will be 10 percent larger than the first. If you lose, the bankroll shrinks by 10 percent, so the second wager will be 10 percent lower than the first.
This is a very safe strategy because if you have a losing streak, the absolute value of the wager shrinks – which means that losses are limited. It also offers large potential rewards since – like compound interest – on a winning streak one’s wealth grows exponentially. It is the best of both worlds: low risk and high return. And just look how it performs: starting slowly but eventually, after around 400 bets, racing way beyond the others.

John Kelly Jr was a Texan mathematician who outlined his famous gambling strategy formula in a 1956 paper, and when Ed Thorp put it into practical use at the blackjack table, the results were striking. ‘As one general said, you get there firstest with the mostest.’ With small edges and judicious money management, huge returns could be achieved. I asked Thorp which method was more important to making money at blackjack – card-counting or using the Kelly criterion. ‘I think the consensus after decades of examining this question,’ he replied, ‘is that the betting strategies may be two thirds or three quarters of what you’re going to get out of it, and playing strategy is maybe a third to a quarter. So, the betting strategy is much more important.’ Kelly’s strategy would later help Thorp make more than $80 billion dollars on the financial markets.
Ed Thorp announced his card-counting system in his 1962 book
Beat the Dealer
. He refined the method for a second edition in 1966 that also counted the cards worth ten (the jack, queen, king and ten). Even though the ten cards shift the odds less than the five do, there are more of them, so it’s easier to identify advantages.
Beat the Dealer
sold more than a million copies, inspiring – and continuing to inspire – legions of gamblers.
In order to eliminate the threat of card-counting, casinos have tried various tactics. The most common was to introduce multiple decks because with more cards, counting is made both more difficult and less profitable. The ‘professor stopper’, a shoe that shuffles many packs at once, is essentially named in Thorp’s honour. And casinos have been forced to make it an offence to use a computer to predict at roulette.
Thorp last played blackjack in 1974. ‘The family went on a trip to the World’s Fair in Spokane and on the way back we stopped at Harrah’s [casino] and I told my kids to give me a couple of hours because I wanted to pay for the trip – which I did.’
Beat the Dealer
is not just a gambling classic. It also reverberated through the worlds of economics and finance. A generation of mathematicians inspired by Thorp’s book began to create models of the financial markets and apply betting strategies to them. Two of them, Fischer Black and Myron Scholes, created the Black-Scholes formula indicating how to price financial derivatives – Wall Street’s most famous (and infamous) equation. Thorp ushered in an era when the quantitative analyst, the ‘quant’ – the name given to the mathematicians relied on by banks to find clever ways of investing – was king. ‘
Beat the Dealer
was kind of the first quant book out there and it led fairly directly to quite a revolution,’ said Thorp, who can claim – with some justification – to being the first-ever quant. His follow-up book,
Beat the Market
, helped transform securities markets. In the early 1970s he, together with a business partner, started the first ‘market neutral’ derivatives hedge fund, meaning that it avoided any market risk. Since then, Thorp has developed more and more mathematically sophisticated financial products, which has made him extremely rich (for a maths professor, anyway). Although he used to run a well-known hedge fund, he now runs a family office in which he invests only his own money.
I met Thorp in September 2008. We were sitting in his office in a high-rise tower in Newport Beach, which looks out over the Pacific Ocean. It was a delicious California day with a pristine blue sky. Thorp is scholarly without being earnest, careful and considered, but also sharp and playful. Just one week earlier, the bank Lehman Brothers had filed for bankruptcy. I asked him if he felt any sense of guilt for having helped create some of the mechanisms that had contributed to the largest financial crisis in decades. ‘The problem wasn’t the derivatives themselves, it was the lack of regulation of the derivatives,’ he replied, perhaps predictably.
This led me to wonder, since the mathematics behind global finance is now so complicated, had the government ever sought his advice? ‘Not that I know of, no!’ he said with a smile. ‘I have plenty here if they ever show up! But a lot of this is highly political and also very tribal.’ He said that if you want to have your voice heard you need to be on the East Coast, playing golf and having lunches with bankers and politicians. ‘But I’m in California with a great view…just playing mathematical games. You’re not going to run into these people, except once in a while.’ But Thorp relishes his position as an outsider. He doesn’t even see himself as a member of the financial world, though he has been for four decades. ‘I think of myself as a scientist who has applied his knowledge to analysing financial markets.’ In fact, challenging the conventional wisdom is the defining theme of his life, something he’s done successfully over and over again. And he thinks that clever mathematicians will always be able to beat the odds.
I was also interested in whether having such a sophisticated understanding of probability helped him avoid the subject’s many counter-intuitions. Was he ever victim, for example, of the gambler’s fallacy? ‘I think I’m very good at just saying no – but it took a while. I went through an expensive education when I first began to learn about stocks. I would make decisions based on less-than-rational decisions.’
I asked him if he ever played the lottery.
‘Do you mean make bad bets?’
I guess, I said, that he didn’t do that.
‘I can’t help it. You know once in a while you have to. Let’s suppose that your whole net worth is your house. To insure your house is a bad bet in the expected-value sense, but it is probably prudent in the long-term survival sense.’
So, I asked, have you insured your house?
He paused for a fewoments. ‘Yes.’
He had stalled because he was working out exactly how rich he was. ‘If you are wealthy enough you don’t have to insure small items,’ he explained. ‘If you were a billionaire and had a million-dollar house it wouldn’t matter whether you insured it or not, at least from the Kelly-criterion standpoint. You don’t need to pay to protect yourself against this relatively small loss. You are better off taking the money and investing it in something better.
‘Have I really insured my houses or not? Yeah, I guess I have.’
I had read an article in which it was mentioned that Thorp planned to have his body frozen when he dies. I told him it sounded like a gamble – and a very Californian one at that.
‘Well, as one of my science-fiction friends said: “It’s the only game in town.”’

I recently bought an electronic kitchen scale. It has a glass platform and an Easy To Read Blue Backlit Display. My purchase was not symptomatic of a desire to bake elaborate desserts. Nor was I intending my flat to become the stash house for local drug gangs. I was simply interested in weighing stuff. As soon as the scale was out of its box I went to my local bakers, Greggs, and bought a baguette. It weighed 391g. The following day I returned to Greggs and bought another baguette. This one was slightly heftier at 398g. Greggs is a chain with more than a thousand shops in the UK. It specializes in cups of tea, sausage rolls and buns plastered in icing sugar. But I had eyes only for the baguettes. On the third day the baguette weighed 399g. By now I was bored with eating a whole baguette every day, but I continued with my daily weighing routine. The fourth baguette was a whopping 403g. I thought maybe I should hang it on the wall, like some kind of prize fish. Surely, I thought, the weights would not rise for ever, and I was correct. The fifth loaf was a minnow, only 384g.
In the sixteenth and seventeenth centuries Western Europe fell in love with collecting data. Measuring tools, such as the thermometer, the barometer and the perambulator – a wheel for clocking distances along a road – were all invented during this period, and using them was an exciting novelty. The fact that Arabic numerals, which provided effective notation for the results, were finally in common use among the educated classes helped. Collecting numbers was the height of modernity, and it was no passing fad; the craze marked the beginning of modern science. The ability to describe the world in quantitative, rather than qualitative, terms totally changed our relationship with our own surroundings. Numbers gave us a language for scientific investigation and with that came a new confidence that we could have a deeper understanding of how things really are.
I was finding my daily ritual of buying and weighing bread every morning surprisingly pleasurable. I would return from Greggs with a skip in my step, eager to see just how many grams my baguette would be. The frisson of expectation was the same as the feeling when you checkggs otball scores or the financial markets – it is genuinely exciting to discover how your team has done or how your stocks have performed. And so it was with my baguettes.
The motivation behind my daily trip to the bakers was to chart a table of how the weights were distributed, and after ten baguettes I could see that the lowest weight was 380g, the highest was 410g, and one of the weights, 403g, was repeated. The spread was quite wide, I thought. The baguettes were all from the same shop, cost the same amount, and yet the heaviest one was almost 8 percent heavier than the lightest one.
I carried on with my experiment. Uneaten bread piled up in my kitchen. After a month or so, I made friends with Ahmed, the Somali manager of Greggs. He thanked me for enabling him to increase his daily stock of baguettes, and as a gift gave me a
pain au chocolat
.
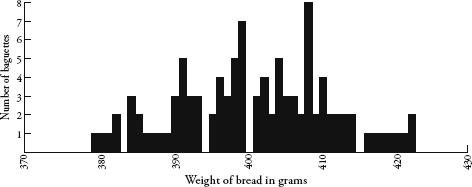
It was fascinating to watch how the weights spread themselves along the table. Although I could not predict how much any one baguette would weigh, when taken collectively a pattern was definitely emerging. After 100 baguettes, I stopped the experiment, by which time every number between 379g and 422g had been covered at least once, with only four exceptions:

I had embarked on the bread project for mathematical reasons, yet I noticed interesting psychological side-effects. Just before weighing each loaf, I would look at it and ponder the colour, length, girth and texture – which varied quite considerably between days. I began to consider myself a connoisseur of baguettes, and would say to myself with the authority of a champion
boulanger
, ‘Now, this is a heavy one’ or ‘Definitely an average loaf today’. I was wrong as often as I was right. Yet my poor forecasting record did not diminish my belief that I was indeed an expert in baguette-assessing. It was, I reasoned, the same self-delusion displayed by sports and financial pundits who are equally unable to predict random events, and yet build careers out of it.
Perhaps the most disconcerting emotional reaction I was having to Greggs’ baguettes was what happened when the weights were either extremely heavy or extremely light. On the rare occasions when I weighed a record high or a record low I was thrilled. The weight was extra special, which made the day seem extra special, as if the exceptionalness of the baguette would somehow be transferred to other aspects of my life. Rationally, I knew that it was inevitable that some baguettes would be oversized and some under-sized. Still, the occurrence of an extreme weight gave me a high. It was alarming how easily my mood could be influenced by a stick of bread. I consider myself unsuperstitious and yet I was unable to avoid seeing meaning in random patterns. It was a powerful reminder of how susceptible we all are to unfounded beliefs.
Despite the promise of certainty that numbers provided the scientists of the Enlightenment, they were often not as certain as all that. Sometimes when the same thing was measured twice, it gave two different results. This was an awkward inconvenience for scientists aiming to find clear and direct explanations for natural phenomena. Galileo Galilei, for instance, noticed that when calculating distances of stars with his telescope, his results were prone to variation; and the variation was not due to a mistake in his calculations. Rather, it was because measuring was intrinsically fuzzy. Numbers were not as precise as they had hoped.
This was exactly what I was experiencing with my baguettes. There were probably many factors that contributed to the variance in weight – the amount and consistency of the flour used, the length of time in the oven, the journey of the baguettes from Greggs’ central bakery to my local store, the humidity of the air and so on. Likewise, there were many variables affecting the results from Galileo’s telescope – such as atmospheric conditions, the temperature of the equipment and personal details, like how tired Galileo was when he recorded the readings.
Still, Galileo was able to see that the variation in his results obeyed certain rules. Despite variation, data for each measurement tended to cluster around a central value, and small errors from this central value were more common than large errors. He also noticed that the spread was symmetrical too – a measurement was as likely to be less than the central value as it was to be more than the central value.
Likewise, my baguette data showed weights that were clustered around a value of about 400g, give or take 20g on either side. Even though none of my hundred baguettes weighed precisely 400g, there were a lot more baguettes weighing around 400g than there were ones weighing around 380g or 420g. The spread seemed pretty symmetrical too.
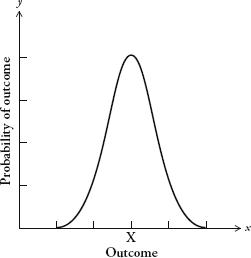
The first person to recognize the pattern produced by this kind of measurement error was the German mathematician Carl Friedrich Gauss. The pattern is described by the following curve, called the bell curve:

Gauss’s graph needs some explaining. The horizontal axis describes a set of outcomes, for instance the weight of baguettes or the distance of stars. The vertical axis is the probability of those outcomes. A curve plotted on a graph with these parameters is known as a
distribution
. It shows us the spread of outcomes and how likely each is.
There are lots of different types of distribution, but the most basic type is described by the curve opposite. The bell curve is also known as the
normal distribution
, or the
Gaussian distribution
. Originally, it was known as the
curve of error
, although because of its distinctive shape, the term
bell curve
has become much more common. The bell curve has an average value, which I have marked X, called the
mean
. The mean is the most likely outcome. The further you go from the mean, the less likely the outcome will be.
When you take two measurements of the same thing and the process has been subject to random error you tend not to get the same result. Yet the more measurements you take, the more the distribution of outcomes begins to look like the bell curve. The outcomes cluster symmetrically around a mean value. Of course, a graph of measurements won’t give you a continuous curve – it will give you (as we saw with my baguettes) a jagged landscape of fixed amounts. The bell curve is a theoretical ideal of the pattern produced by random error. The more data we have, the closer the jagged landscape of outcomes will fit the curve.
In the late nineteenth century the French mathematician Henri Poincaré knew that the distribution of an outcome that is subject to random measurement error will approximate the bell curve. Poincaré, in fact, conducted the same experiment with baguettes as I did, but for a different reason. He suspected that his local boulangerie was rpping him off by selling underweight loaves, so he decided to exercise mathematics in the interest of justice. Every day for a year he weighed his daily lkg loaf. Poincaré knew that if the weight was less than 1kg a few times, this was not evidence of malpractice, since one would expect the weight to vary above and below the specified 1kg. And he conjectured that the graph of bread weights would resemble a normal distribution – since the errors in making the bread, such as how much flour is used and how long the loaf is baked for, are random.
After a year he looked at all the data he had collected. Sure enough, the distribution of weights approximated the bell curve. The peak of the curve, however, was at 950g. In other words, the average weight was 0.95kg, not 1kg as advertised. Poincaré’s suspicions were confirmed. The eminent scientist was being diddled, by an average of 50g per loaf. According to popular legend, Poincaré alerted the Parisian authorities and the baker was given a stern warning.
After his small victory for consumer rights, Poincaré did not let it lie. He continued to measure his daily loaf, and after the second year he saw that the shape of the graph was not a proper bell curve; rather, it was skewed to the right. Since he knew that total randomness of error produces the bell curve, he deduced that some non-random event was affecting the loaves he was being sold. Poincaré concluded that the baker hadn’t stopped his cheapskate, underbaking ways but instead was giving him the largest loaf at hand, thus introducing bias in the distribution. Unfortunately for the
boulanger
, his customer was the cleverest man in France. Again, Poincaré informed the police.
Poincaré’s method of baker-baiting was prescient; it is now the theoretical basis of consumer protection. When shops sell products at specified weights, the product does not legally have to be that exact weight – it cannot be, since the process of manufacture will inevitably make some items a little heavier and some a little lighter. One of the jobs of trading-standards officers is to take random samples of products on sale and draw up graphs of their weight. For any product they measure, the distribution of weights must fall within a bell curve centred on the advertised mean.
Half a century before Poincaré saw the bell curve in bread, another mathematician was seeing it wherever he looked. Adolphe Quételet has good claim to being the world’s most influential Belgian. (The fact that this is not a competitive field in no way diminishes his achievements.) A geometer and astronomer by training, he soon became sidetracked by a fascination with data – more specifically, with finding patterns in figures. In one of his early projects, Quételet examined French national crime statistics, which the government started publishing in 1825. Quételet noticed that the number of murders was pretty constant every year. Even the proportion of different types of murder weapon – whether it was perpetrated by a gun, a sword, a knife, a fist, and so on – stayed roughly the same. Nowadays this observation is unremarkable – indeed, the way we run our public institutions relies on an appreciation of, for example, crime rates, exam pass rates and accident rates, which we expect to be comparable every year. Yet Quételet was the first person to notice the quite amazing regularity of social phenomena when populations are taken as a whole. In any one year it was impossible to tell who might become a murderer. Yet in any one year it was possible to predict fairly accurately how many murders would occur. Quételet was troubled by the deep questions about personal esponsibility this pattern raised and, by extension, about the ethics of punishment. If society was like a machine that produced a regular number of murderers, didn’t this indicate that murder was the fault of society and not the individual?
