Alex’s Adventures in Numberland (60 page)
Read Alex’s Adventures in Numberland Online
Authors: Alex Bellos

Part of this is the law of large numbers. If I analysed every match in every World Cup, I can be very confident that the result would be closer to 50.7 percent. Yet there is another variable. Are the birthdays of footballers equally distributed throughout the year? Probably not. Research shows that footballers are more likely to be born at certain times of the year – favouring those born just after the school year cut-off point, since they will be the oldest and largest in their school years, and will therefore dominate sports. If there is a bias in the spread of birth dates, we can expect a higher chance of shared birthdays. And often there is a bias. For example, a sizeable proportion of babies are now born by caesarian section or induced. This tends to happen on weekdays (as maternity staff prefer not to work weekends), with the result that births are not spread as randomly throughout the year. If you take a section of 23 people born in the same 12-month period – say, the children in a primary-school classroom – the chance of two pupils sharing the same birthday will be significantly more than 50.7 percent.
If a group of 23 people is not immediately accessible to test this out, just look at your immediate family. With 4 people it is 70 percent likely that 2 will have birthdays within the same month. You y need 7 people for it to be likely that 2 of them were born in the same week, and in a group of 14 it is as likely as not that 2 people were born within a day of each other. As group size gets bigger, the probability rises surprisingly fast. In a group of 35 people, the chance of a shared birthday is 85 percent, and with a group of 60 the chance is more than 99 percent.
Here’s a different question about birthdays with an answer as counter-intuitive as the birthday paradox: how many people do there need to be in a group for there to be a more than 50 percent chance that someone shares
your
birthday. This is different from the birthday paradox because we are specifying a date. In the birthday paradox we are not bothered who shares a birthday with whom; we just want a shared birthday. Our new question can be rephrased as: given a fixed date, how many times do we need to roll our 365-sided dice until it lands on this date? The answer is 253 times! In other words, you would need to assemble a group of 253 people just to be more sure than not that one of them shares your birthday. This seems absurdly large – it is well over halfway between one and 365. Yet randomness is doing its clustering thing again – the group needs to be that size because the birthdays of its members are not falling in an orderly way. Among those 253 people there will be many people who double up on birthdays that are not yours, and you need to take them into account.
A lesson of the birthday paradox is that coincidences are more common than you think. In German Lotto, like the UK National Lottery, each combination of numbers has a 1-in-14-million chance of winning. Yet in 1995 and in 1986 identical combinations won: 15-25-27-30-42-48. Was this an amazing coincidence? Not especially, as it happens. Between the two occurrences of the winning combination there were 3016 lottery draws. The calculation to find how many times the draw should pick the same combination is equivalent to calculating the chances of two people sharing the same birthday in a group of 3016 people with there being 14 million possible birthdays. The probability works out to be 0.28. In other words, there was more than a 25 percent chance that two winning combinations would be identical over that period; so the ‘coincidence’ was therefore not an extremely weird occurrence.
More disturbingly, a misunderstanding of coincidence has resulted in several miscarriages of justice. In one famous California case, from 1964, witnesses to a mugging reported seeing a blonde with a ponytail, a black man with a beard and a yellow getaway car. A couple fitting this description were arrested and charged. The prosecutor calculated the chance of such a couple existing by multiplying the probabilities of the occurrence of each of detail together: for a yellow car,
 for a blonde, and so on. The prosecutor calculated that the chance of such a couple existing was 1 in 12 million. In other words, for every 12 million people, only one couple on average would fit the exact description. The chances of the arrested couple being the guilty couple, he argued, were overwhelming. The couple was convicted.
The prosecutor, however, was doing the wrong calculation. He had worked out the chance of randomly selecting a couple that matched the witness profiles. The relevant question should have been, given there is a couple that matches the description, what is the chance that the arrested couple is the guilty couple? This probability was only about 40 percent. More likely than not, therefore, the fact that the arrested couple fitted the description was a coincidence. In 1968 the California Supreme Court reversed the conviction.
Returning to the world of gambling, in another lottery case a New Jersey woman won her state lottery twice in four months in 1985–6. It was widely reported that the chances of this happening was 1 in 17 trillion. However, though 1 in 17 trillion was the correct chance of buying a single lottery ticket in both lotteries and scooping the jackpot on both occasions, this did not mean that the chances of someone, somewhere winning two lotteries was just as unlikely. In fact, it is pretty likely. Stephen Samuels and George McCabe of Purdue University calculated that over a seven-year period the odds of a lottery double-win in the United States are better than evens. Even over a four-month period, the odds of a double winner somewhere in the country are better than 1 in 30. Persi Diaconis and Frederick Mosteller call this the
law of very large numbers
: ‘With a large enough sample, any outrageous thing is apt to happen.’
Mathematically speaking, lotteries are by far the worst type of legal bet. Even the most miserly slot machine has a payback percentage of about 85 percent. By comparison, the UK National Lottery has a payback percentage of approximately 50 percent. Lotteries offer no risk to the organizers since the prize money is just the takings redistributed. Or, in the case of the National Lottery, half of the takings, redistributed.
In rare instances, however, lotteries can be the best bet around. This is the case when, due to ‘rollover’ jackpots, the prize money has grown to become larger than the cost of buying every possible combination of numbers. In these instances, since you are covering all outcomes, you can be assured of having the winning combination. The risk here is only that there might be other people who also have the winning combination – in which case you will have to share the first prize with them. The buy-every-combination approach, however, relies on an ability to do just that – which is a significant theoretical and logistical challenge.
The UK lottery is a 6/49 lottery, which means that for each ticket the punter must select 6 numbers out of 49. There are about 14 million possible combinations. How do you list these combinations in such a way that each combination is listed exactly once, avoiding duplications? In the early 1960s, Stefan Mandel, a Romanian economist, asked himself the same question about the smaller Romanian lottery. The answer is not straightforward. Mandel cracked it, however, after spending several years on the problem and won the Romanian lottery in 1964. (In fact, in this case he did not buy every combination, since that would have cost him too much money. He used a supplementary method called ‘condensing’ that guarantees that at least 5 of the 6 numbers are correct. Usually getting 5 numbers means winning second prize, but he was lucky and won first prize first time.) The algorithm that Mandel had written out to decide which combinations to buy covered 8000 foolscap sheets. Shortly afterwards, he emigrated to Israel and then to Australia.
While in Melbourne, Mandel founded an international betting syndicate, raising enough money from its members to ensure that, if he wanted to buy every single combination in a lottery, then he could. He surveyed the world’s lotteries for rollover jackpots that were more than three times the cost of every combination. In 1992 he identified the Virginia state lottery – a lottery with seven million combinations, each costing $1 a ticket – whose jackpot had reached almost $28 million. Mandel got to work. He printed out coupons in Australia, filled them in by computer so that they covered the seven million combinations, and then flew the coupons to the UShad w won the first prize and 135,000 secondary prizes too.
The Virginia lottery was Mandel’s largest jackpot, bringing his tally since leaving Romania to 13 lottery wins. The US Internal Revenue Service, the FBI and the CIA all looked into the syndicate’s Virginia lottery win, but could prove no wrongdoing. There is nothing illegal about buying up every combination, even though it sounds like a scam. Mandel has now retired from betting on lotteries and lives on a tropical island in the South Pacific.
A particularly useful visualization of randomness was invented by John Venn in 1888. Venn is perhaps the least spectacular mathematician ever to become a household name. A Cambridge professor and Anglican cleric, he spent much of his later life compiling a biographical register of 136,000 of the university’s pre-1900 alumni. While he did not push forward the boundaries of his subject, he did, nevertheless, develop a lovely way of explaining logical arguments with intersecting circles. Even though Leibniz and Euler had both done something very similar in previous centuries, the diagrams are named after Venn. Much less known is that Venn thought up an equally irresistible way to illustrate randomness.
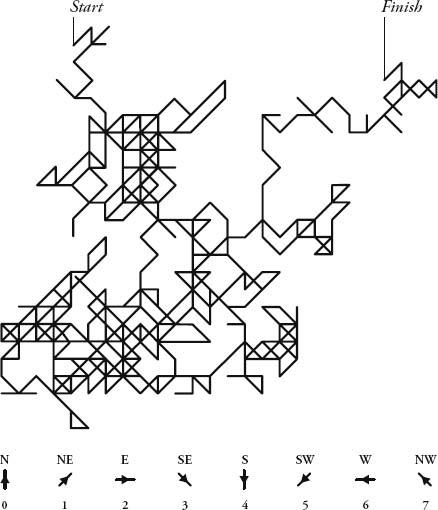
Imagine a dot in the middle of a blank page. From the dot there are eight possible directions to go: north, northeast, east, southeast, south, southwest, west and northwest. Assign the numbers 0 to 7 to each of the directions. Choose a number from 0 to 7 randomly. If the number comes up, trace a line in that direction. Do this repeatedly to create a path. Venn carried this out with the most unpredictable sequence of numbers he knew: the decimal expansion of pi (excluding 8s and 9s, and starting with 1415). The result, he wrote, was ‘a very fair graphical indication of randomness’.
Venn’s sketch is thought to be the first-ever diagram of a ‘random walk’. It is often called the ‘drunkard’s walk’ because it is more colourful to imagine that the original dot is instead a lamp-post and the path traced is the random staggering of a drunk. One of the most obvious questions to ask is how far will the drunk wander from the point of origin before collapsing? On average, the longer he has been walking, the further away he will be. It turns out that his distance increases with the square root of the time spent walking. So, if in one hour he stumbles, on average, one block from the lamp-post, it will take him four hours, on average, to go two blocks, and nine hours to go three.
As the drunkard randomly walks, there will be times when he goes in circles and doubles back on himself. What is the chance of the drunk eventually walking back into the lamp-post? Surprisingly, the answer is 100 percent. He might stray for years in the most remote places but it is a sure thing that, given sufficient time, the drunk will eventually return to base.
Imagine a drunkard’s walk in three dimensions. Call it the buzz of the befuddled bee. The bee starts at a point suspended in space and then flies in a straight line in a random direction for a fixed distance. The bee stops, dozes, then buzzes off in another random direction for the same distance. And so on. What is the chance of the bee eventually buzzing back into the spot where it started? The answer is only 0.34, or about a third. It was weird to realize that in two dimensions the chance of a drunkard walking back into the lamp-post was an absolute certainty, but it seems even weirder to think that a bee buzzing for ever is very unlikely ever to return home.