Ancient DNA: Methods and Protocols (45 page)
Read Ancient DNA: Methods and Protocols Online
Authors: Beth Shapiro

aligning DNA sequences. J Comput Biol
understanding of 2 base color codes and its
7(1–2):203–214
application to annotation, error detection, and
78. Morgulis A et al (2008) Database indexing for
error correction. In: White Paper SOLiD™
production MegaBLAST searches.
System Volume. Life Technologies, Carlsbad
Bioinformatics 24(16):1757–1764
Phylogenetic Analysis of Ancient DNA using
BEAST
Simon Y. W. Ho
Abstract
Under exceptional circumstances, it is possible to obtain DNA sequences from samples that are up to hundreds of thousands of years old. These data provide an opportunity to look directly at past genetic diversity, to trace the evolutionary process through time, and to infer demographic and phylogeographic trends. Ancient DNA (aDNA) data sets have some degree of intrinsic temporal structure because the sequences have been obtained from samples of different ages. When analyzing these data sets, it is usually necessary to take the sampling times into account. A number of phylogenetic methods have been designed with this purpose in mind. Here I describe the steps involved in Bayesian phylogenetic analysis of aDNA data. I outline a procedure that can be used to co-estimate the genealogical relationships, mutation rate, evolutionary timescale, and demographic history of the study species in a single analytical framework. A number of modifi cations to the methodology can be made in order to deal with complicating factors such as postmortem damage, sequences from undated samples, and data sets with low information content.
Key words:
Heterochronous sequences , Postmortem damage , Mutation rate , Bayesian analysis , Coalescent , Demographic reconstruction , Skyline plot
1. Introduction
Nucleic acids are able to survive for hundreds of thousands of years if preservational conditions are highly favorable. Sequences of these ancient DNA (aDNA) molecules can provide a useful source of data for a variety of studies, ranging from evolutionary biology to forensic archaeology
( 1, 2
) . By applying phylogenetic methods to aDNA sequence data, it is possible to estimate the evolutionary relationships of extinct species and identify samples of uncertain taxonomic affi nity. Within species, aDNA analysis can improve our capacity to estimate demographic history, past phylogeographic patterns, and evolutionary timescales
( 3 )
.
Beth Shapiro and Michael Hofreiter (eds.),
Ancient DNA: Methods and Protocols
, Methods in Molecular Biology, vol. 840, DOI 10.1007/978-1-61779-516-9_24, © Springer Science+Business Media, LLC 2012
229
230
S.Y.W. Ho
In studies conducted at higher taxonomic levels, such as comparisons among species, differences in sampling times are usually trivial in relation to the overall depth of the phylogeny. For example, the sampling times of most woolly mammoth sequences are less than 1% of the age of the family Elephantidae
( 4
) . In these instances, ancient and modern sequences can be treated as practically coetane-ous and standard phylogenetic methods can be employed, including those based on the molecular clock
( 5, 6
) . At the intraspecifi c level, however, the sampling times of the data often span a conse-quential proportion of the overall history of the population—that is, the population is considered to be “measurably evolving”
( 7 )
. If this is the case, failure to take into account the ages of the sequences in the data set can lead to estimation biases.
This article will focus on the analysis of samples drawn from measurably evolving populations, which requires phylogenetic methods that have been explicitly designed to accommodate heterochronous sequences. Such methods are available in a number of computer programs, including
Serial SimCoal
( 8
) , PAML
( 9 )
,
TREBLE
( 10 )
, and
BEAST
( 11 )
. Some of these employ a Bayesian statistical approach in which all parameters (including the tree) have a prior distribution that is altered by the observed data to pr
oduce a posterior distribution ( 12
) . The procedure described below uses the Bayesian phylogenetic software
BEAST
(
Bayesian Evolutionary Analysis by Sampling Trees
), which is able to implement a wide range of evolutionary models. Most of these models have a basis in coalescent theory
( 13 )
, a statistical framework that describes the relationship between the genealogy and the demographic history of the sampled individuals.
Phylogenetic analysis using
BEAST
involves a number of discrete steps. Beginning with an alignment of the DNA sequences, an input fi le for
BEAST
is created using the software
BEAUti
(
Bayesian Evolutionary Analysis Utility
), available as part of the
BEAST
package. The user needs to select appropriate evolutionary models for the analysis.
BEAST
then analyzes the data set using an approach
based on Markov chain Monte Carlo simulation ( 14 )
. After the BEAST analysis is complete, the results are processed using associated software, including
Tracer
( 15 )
and
TreeAnnotator
.
2. Materials
2.1. Data Set
DNA sequence data can be obtained using a range of methods, including those based on Sanger sequencing and pyrosequencing (
see other chapters
,
ibid
.). There are several important factors to consider when selecting markers for a phylogenetic analysis. Above all, the sequences need to be suffi ciently variable for analysis using a Bayesian phylogenetic approach. Accordingly, a guiding principle 24 Phylogenetic Analysis of Ancient DNA using
BEAST
231
of sampling design is to identify markers that maximize information content relative to sequencing effort.
It is important to use markers that meet the assumptions of the available phylogenetic methods. The intraspecifi c evolutionary models in
BEAST
are based on a relatively simple form of the coalescent, which involves the assumption that there is random mating among individuals in the study population. It is also assumed that sequences are evolving neutrally, without recombination, and without lateral transfer.
It is usually of interest to attach a real timescale to the phylogenetic estimate, which can be done by including independent calibrating information. In aDNA data sets, the known ages of the
sequences can be used for calibration ( 16, 17
) . If the sampling times are unknown, they can be estimated radiometrically, strati-graphically, or phylogenetically
( 18, 19 )
(see Note 1). If the age range of the sequences spans a large proportion of the total evolutionary history of the study population, the sampling times can provide suffi cient calibrating information for the analysis
( 7, 17 )
.
Once the sequences are obtained, they need to be assembled and aligned. Automated sequence alignment can be performed using a number of computer programs. In some instances, there are few or no indels and alignment is trivial. Generally, however, alignment needs to be performed carefully because it can have a considerable impact on subsequent analyses.
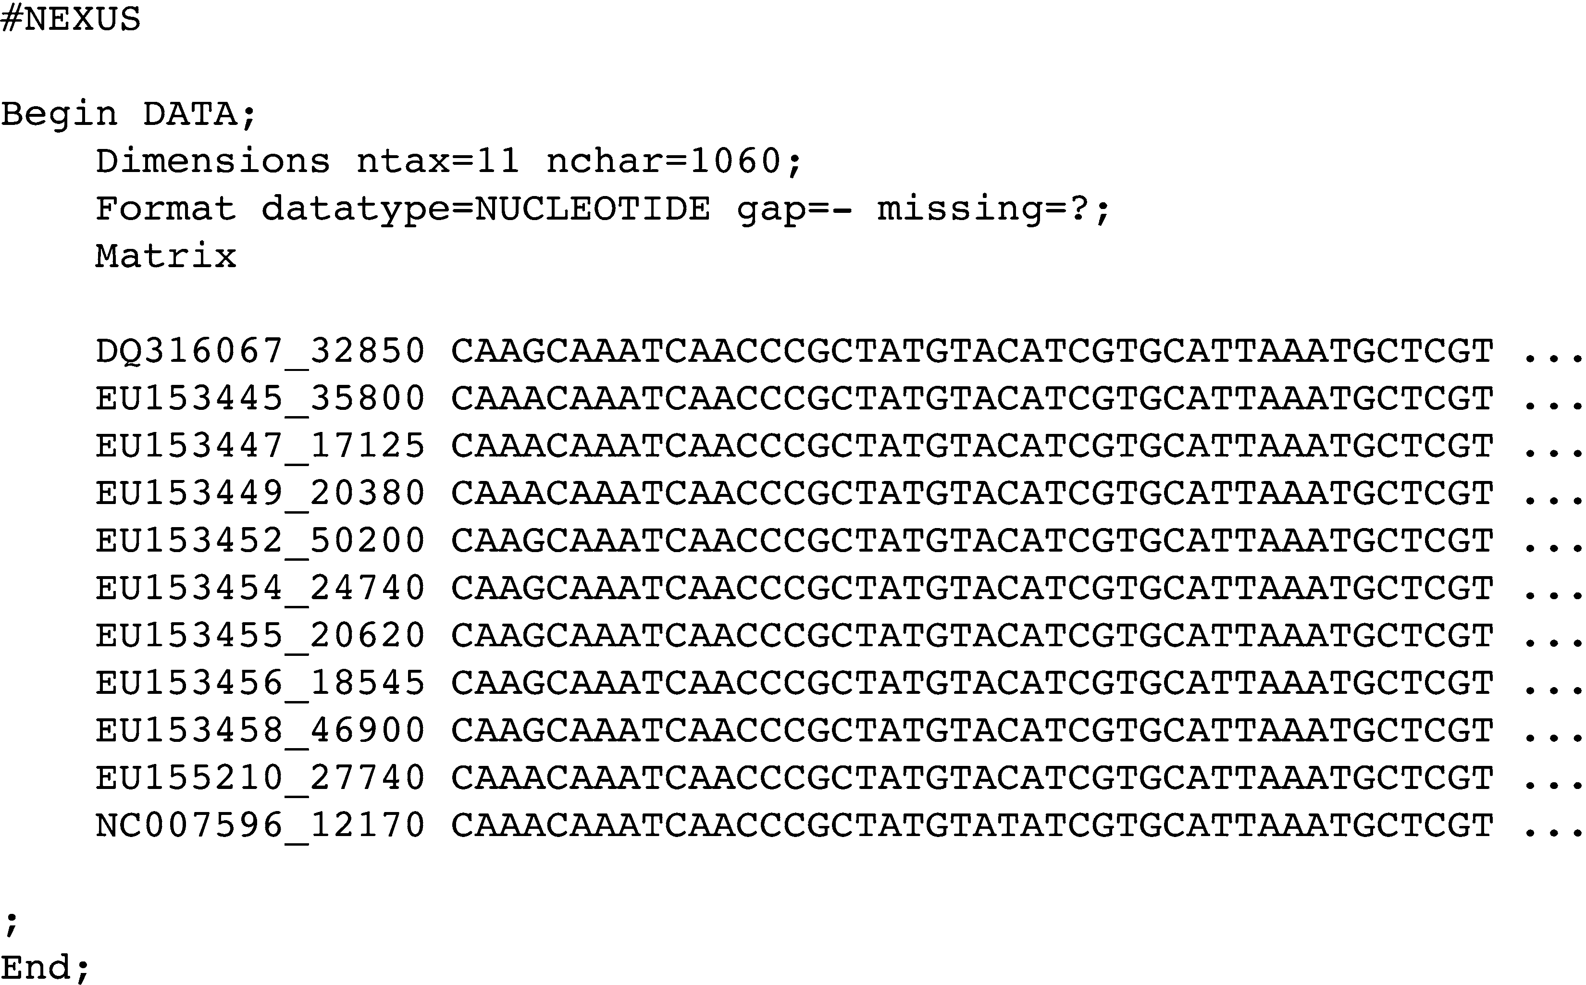
Sequence alignments should be given in Nexus format. If the user is planning to partition the data set to allow different evolutionary models to be applied to different regions (e.g., different genes), a separate Nexus fi le should be created for each partition.
Optional metadata, such as sampling time, can be included in the sequence name (e.g., as a suffi x). If there are multiple alignment fi les, care should be taken to ensure consistency in sequence names across the data sets. A simplifi ed example of a Nexus-formatted
alignment is shown in Fig. 1
.
2.2. Software
The analysis requires a number of different computer programs, all of which are available on the offi cial
BEAST
website (http://beast.
bio.ed.ac.uk/). The fi rst four programs below are included in the BEAST package.
1.
BEAUti
. This program is used to create XML-formatted input fi les for
BEAST
.
2.
BEAST
. This program performs Bayesian phylogenetic analysis.
3.
LogCombiner
. This program is used to process some of the output from
BEAST
.
4.
TreeAnnotator
. This program is used to process some of the output from
BEAST
.

232
S.Y.W. Ho
Fig. 1. A simple example of an alignment in Nexus format. The alignment comprises sequences from the mitochondrial control region of 11 woolly mammoths (
Mammuthus primigenius
). Each sequence name contains the GenBank accession number followed by the age of the sequence (in years), with the two fi elds separated by an underscore.
5.
Tracer
. This is a diagnostic program that is used to examine the output from
BEAST
.
6.
FigTree
. This is a tree-viewing program that can be used to display the phylogenetic estimates produced in a
BEAST
analysis.
3. Methods
Performing a Bayesian phylogenetic analysis can be a complicated procedure. The software
BEAST
provides a very fl exible framework for implementing a variety of models, but it is for this reason that the program requires detailed input fi les. Fortunately, these can be readily created using the companion software
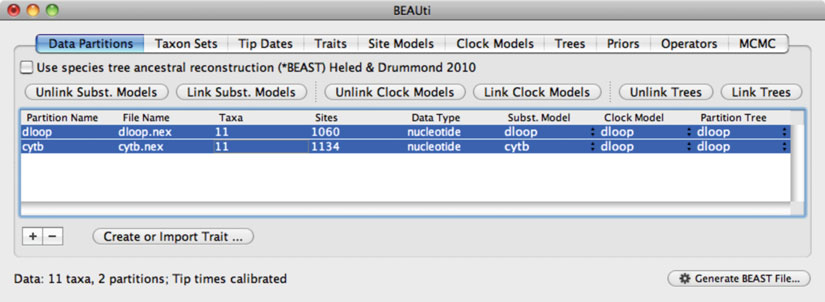
BEAUti
(Fig. 2 ). Once the
BEAST
analysis is complete, the output fi les need to be processed using further software.
3.1. Setting Up the
1. Run the software
BEAUti
and import the sequence alignment(s).
Input File
Details of each data set will be displayed in the window.
2. In “Data Partitions,” the user can choose to link or unlink substitution models, clock models, and trees across data partitions.

24 Phylogenetic Analysis of Ancient DNA using
BEAST
233
Fig. 2. Screenshot of the software
BEAUti
, which is used to create input fi les for the Bayesian phylogenetic software
BEAST
.
The “Data Partitions” tab shows that two sequence alignments (mitochondrial D-loop and cytochrome
b
) have been loaded.
The two data partitions share the same clock model and tree, but have been assigned separate models of nucleotide substitution.
If models are “unlinked,” a distinct model can be chosen for each partition and parameters will be estimated separately.
3. In “Taxon Sets,” defi ne any clades that are of interest in the analysis.
(a)
Defi ne any clades that are to be used for internal-node calibrations. If an estimate of the age of an internal node is available from an independent source, such as the fossil
record or biogeography, this information can be incorporated into the analysis (see step 8 below).
(b) Defi ne any clades for which monophyly is to be enforced.
4. In “Tip Dates,” the sampling times need to be specifi ed for all sequences in the data set. Check the box next to “Use tip
dates,” select “Guess Dates,” then select the option that
describes the position of the sequence age in the sequence name. For example, if the age of each sequence has been
appended as a suffi
x (as in Fig. 1 ), select “last” in the dr
op-down menu next to “Defi ned by its order.” The dates will automatically be entered into the “Date” column. In the drop-down menu, select either “Since some time in the past” or “Before the present” as appropriate. If any sampling times are unknown, “Tip date sampling” can be activated (see Note 1).
For some data sets, the sampling times might not provide suffi cient calibrating information (see Note 2).
