Crimes Against Liberty (43 page)
Read Crimes Against Liberty Online
Authors: David Limbaugh

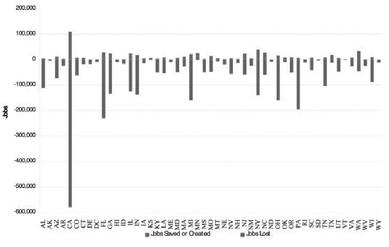
As detailed in chapter three, the stimulus did not cause a jobs spurt, but an enormous job loss. A Bureau of Labor statistics chart shows, state by state, that through December 2009, 3,179,328 jobs were lost—while the administration claims 638,825 jobs were “created or saved.” Veronique de Rugy, a senior research fellow at the Mercatus Center at George Mason University, notes this means that for every job “created or saved”—a concept she mocks as “a completely fictitious and unverifiable metric”—six jobs were lost as shown in this chart:
Impact of the Stimulus Jobs toss Dominates Job Creation

Source: Bureau of Labour Statistics, Recovery.gov
Of the few jobs that were actually created, most were in the public sector, contradicting another administration claim. De Rugy said data from
Stimulus Watch
revealed only 140,765 of the 638,825 jobs the administration claimed to have created or saved with stimulus funds were private sector jobs. To the extent the stimulus was stimulating anything, it was government—the last thing we need. Going from bad to worse, the Bureau of Labor Statistics reported that since the stimulus bill was passed, the private sector had suffered a net loss of 2,610,000 employees, while the government had only lost 46,000 employees. The number of private jobs lost compared to private jobs created is “far greater than 6.” Dr Rugy concluded that since the CBO had recently admitted it was “impossible to determine how many of the reported jobs would have existed” without the stimulus, “it seems clear that for the sake of taxpayers and for the sake of job creation, a second stimulus is absolutely the wrong idea.”
12
Yet such common sense didn’t deter Obama and Congress, which passed the second stimulus bill, offensively called the “Jobs Bill,” on March 17, 2010.
13
Moreover, the pathetic results of Obama’s stimulus also did not prevent Vice President Joe Biden from declaring the stimulus an “absolute success.” Nor did it keep Obama from deceitfully boasting in a speech in Wisconsin in June 2010 that without his stimulus the economy would have been much worse—an argument that is at odds with the evidence and, at any rate, is impossible to conclusively prove. He also declared, “Every economist who’s looked at it has said that the [stimulus] did its job.” That’s quite an interesting claim in light of the Heritage Foundation’s statement earlier that month that “for objective observers the failure of President Obama’s $862 billion stimulus package has become increasingly difficult to deny.”
14
EXPLODING DEFICITS AND NATIONAL DEBT
It appears that the only thing the stimulus bill created—other than public sector jobs—was astronomical federal debt. Indeed, the ultimate scandal of the Obama administration—and this is a tough call, given ObamaCare as well as Obama’s virtual surrender in the war on terror—is its exponential growth of the national debt to unsustainable levels that put the nation on a path to bankruptcy. One would have expected that after the extraordinary TARP expenditures, prudent politicians would have pulled the reins in for the sake of the nation’s fiscal stability. But Obama did the opposite with his myriad indulgent initiatives, as listed above. He never intended to pull back government spending, but obviously planned on perpetuating the economic crisis and milking it to redistribute every dollar he could from certain citizens and companies to others. While mouthing phony bromides about fiscal stewardship, he is continuing to spend at a breakneck pace, with the apparent strategy to get us into such debt that our only way out will be to increase taxes, possibly even enacting a Value Added Tax (VAT), as noted in chapter three.
A VAT is especially insidious because it is invisible; it’s incorporated in the price of goods and services, which makes it easier for government to raise the rates. Every European nation began promising a low VAT rate, but all have raised their rates to at least 15 percent—and some much higher for the ostensible purpose of balancing their budgets. The problem is that the VAT, along with other tax hikes, simply won’t extricate us from our fiscal imbalance and unprecedented debt. These tax increases (as the Bush tax cuts expire and the new ObamaCare taxes kick in) would smother an already ailing economy, just as it needs to be unshackled.
The 2009 fiscal year deficit of $1.41 trillion—as compared with the 2008 fiscal year deficit of $454.8 billion—could be blamed largely on TARP and other items, and much of it occurred during President Bush’s last year in office, albeit under a Democratic congressional majority. But Obama had no such excuses for his profligacy in FY2010. In February 2009 Obama presented a projected budget deficit of $1.258 trillion for FY2010, and a cumulative, ten-year deficit of $7.107 trillion for FY2010-2019. Just a year later, he had to revise those figures dramatically upward, offering a projected FY2010 deficit of $1.56 trillion, some $300 billion higher. His revised projected cumulative deficit for fiscal years 2010-2019 was $9.086 trillion, almost $2 trillion higher, as shown on the Heritage Chart on the right.
President Proposes $2 Trillion More in 2010-2019 Deficits Than Last Year
| Proposed Budget Deficits, in Billions, by Fiscal Year | ||
|---|---|---|
| | LastYear’s Budget Proposal | ThisYear’s Budget Proposal |
| 2010 | -$1, 258 | -$1,556 |
| 2011 | -$929 | -$1,267 |
| 2012 | -$557 | -$829 |
| 2013 | -$512 | -$727 |
| 2014 | -$536 | -$706 |
| 2015 | -$528 | -$752 |
| 2016 | -$645 | -$778 |
| 2017 | -$675 | -$778 |
| 2018 | -$688 | -$785 |
| 2019 | -$779 | -$908 |
| Total | -$7,107 | -$9,086 |
Source
: Table S- of President Obama’s FY 2010 and FY 2011 budgets.
Obama unveiled his FY2011 budget in February 2010, with his Office of Management and Budget (OMB) projecting the cumulative deficit for FY2011-2020 at $8.53 trillion. The CBO projected it would be $9.75 trillion—almost $1.2 trillion higher. This difference in calculation, according to Brian Riedl, “represents an additional debt of $10,000 per household above and beyond the federal debt they are already carrying.”
15
The
Washington Times
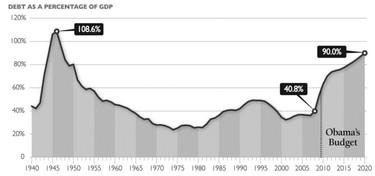
reported that the federal public debt was $6.3 trillion when Obama took office, amounting to $56,000 per household. It now totals $8.2 trillion ($72,000 per household) and is headed toward $20.3 trillion by 2020 (more than $170,000 per household and more than triple the debt of $6.3 trillion when Obama took office). According to the CBO, this would increase the national debt to 90 percent of the nation’s total economic output by 2020, compared to 40 percent of GDP at the close of fiscal year 2008,
16
as illustrated on the chart on the opposite page.
Some experts believe the forecast is much worse: that if we don’t repeal the Obama tax and regulatory policies and reform entitlements substantially we’ll end up with a ruinous debt-to-GDP ratio of 104 percent by 2019.
17
At any rate, this projected tripling of the national debt, though based on Obama’s fiscal agenda, wouldn’t finally occur until 2020, four years after the end of Obama’s second term, should he be re-elected. But Riedl looks at the projections for Obama’s hypothetical two terms and finds that just in his eight years, Obama would more than double the national debt. Riedl notes Obama “harshly criticized” Bush for the $3.3 trillion in budget deficits he accumulated in his eight years in office, but the conservative projected deficits for Obama’s eight years total $7.6 trillion (averaging almost $1 trillion per year), which is almost two and a half times Bush’s cumulative total and easily more than the total debt to date of $6.3 trillion when Obama took office.
18
And this is without even considering the recent upward revisions to ObamaCare, his cap and tax dream, or a host of other expensive proposals he seeks to enact.
Obama’s Budget Would Send Federal Debt to Levels Not Seen Since World War II
In 2008, publicly held debt as a percentage of the economy (GDP) was 40.8 percent, nearly five points below the post-war average. Under President Obama’s budget, this figure would more than double to 90 percent by 2020. Continued structural debt poses serious economic risks.

Source:
Congressional Budget Office and White House Office of Management and Budget
Obama said he wouldn’t be able to bring the deficit down “overnight,” but claimed he’d be well on his way to reductions once the recovery took hold. But Heritage’s Conn Carroll observed, “Not only does President Obama’s budget fail to reduce deficits ‘overnight,’” it “actually moves them in the opposite direction.” Obama’s budget would “permanently expand the federal government by nearly 3 percent of GDP
over pre-recession levels
. . . and leave permanent deficits that top $1 trillion in as late as 2020.”
19
While Obama glibly dismisses his bankrupting deficits as being caused by (and no greater than) those generated by President George W. Bush, nothing could be more misleading. We’ve already noted Congressman Jeb Hensarling’s point that Democrats took control of Congress in 2006 and that CBO numbers show that the Democrats’ and Obama’s budgets dwarf those of the Republican-controlled congresses of the preceding twelve years. And simply comparing the Bush deficits to the Obama deficits presents a similar picture. Bush’s budgets averaged some $300 billion
20
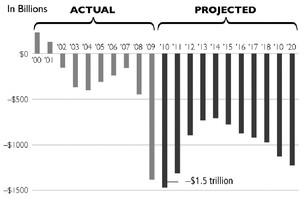
—and it wasn’t until his last year in office, when the economic downturn and financial crisis hit hard and sparked the TARP program, that he (and Congress) produced the type of outrageous deficit Obama is routinely generating as far as the eye can see. This Heritage Chart brings this into clear perspective:
Obama Deficits Will Exceed Previous Deficits

Sources:
Congressional Budget Office and Office of Management and Budget.
Obama whines about inheriting a $1.3 trillion deficit “when I walked in the door” and forever uses that as an excuse to crank up spending even further. But as Dick Morris points out, Bush’s projected deficit for FY2008 was about $485 billion and grew another $100 billion by the start of the fiscal crisis to about $600 billion. TARP raised it $700 billion to around $1.3 trillion, though revised figures showed the deficit ended up being around $1.41 trillion, as noted. But as Morris correctly observes, most of the TARP money was paid back, so in reality the Bush deficit for that year was much lower, maybe $800 billion .
21
