Financial Shenanigans: How to Detect Accounting Gimmicks & Fraud in Financial Reports, 3rd Edition (34 page)
Authors: Howard Schilit,Jeremy Perler
Tags: #Business & Economics, #Accounting & Finance, #Nonfiction, #Reference, #Mathematics, #Management

While unfortunately we can be of no help to the FBI in its search for Hoffa, we certainly can help investors find clues to the whereabouts of hidden cash outflows. Chapter 11 shows you exactly where to look. We’ll show you how to find these outflows that management loves to bury in the Investing section, even though they seem more like operating-related outflows. And we’ll discuss the following three primary techniques that companies use to shift these operating cash outflows to the Investing section.
Techniques to Shift Normal Operating Cash Outflows to the Investing Section
1. Inflating CFFO with Boomerang Transactions
2. Improperly Capitalizing Normal Operating Costs
3. Recording the Purchase of Inventory as an Investing Outflow
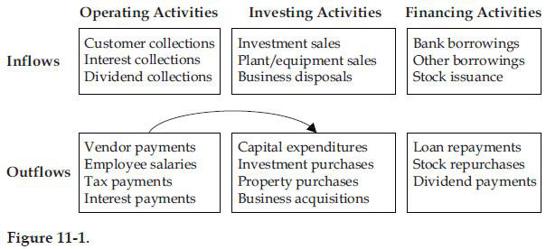
All three methods are examples of those used by companies that inflate cash flow from operations (CFFO) by dumping normal operating costs into the Investing section, as shown in Figure 11-1.
1. Inflating CFFO with Boomerang Transactions
Global Crossing was one of the highest-flying technology companies during the 1990s dot-com bubble. It was building an undersea fiber-optic cable network that would connect more than 200 cities across four continents, and investors appeared to be absolutely giddy over its prospects. However, as the project neared completion in 2000 and early 2001, critics began to wonder whether Global Crossing would ever sell enough network capacity to recoup the extensive costs of the project and pay down its massive debt.
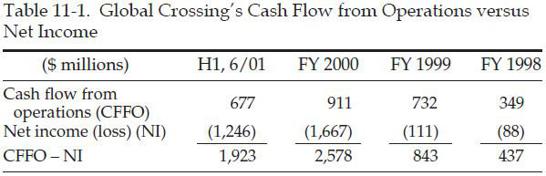
When questioned, Global Crossing always seemed to have a great rebuttal for these naysayers: “Look at all the cash we are generating.” Global Crossing had entered into many substantial contracts in which it sold future capacity and received cash from customers up front—and it had the CFFO to prove it. In 2000, despite a
negative
$1.7 billion in earnings, the company reported to investors a
positive
$911 million in operating cash flow. (See Table 11-1.)
Normally, investors would be overjoyed about a company that generates substantially more CFFO than net income. Indeed, some of the differential was legitimately explained by these advances received from customers. However, a sizable portion related to a boomerang scheme to manipulate its CFFO.
As the technology industry was facing a slowdown, Global Crossing and other telecom players came up with a plan to effectively sell products to each other and, in so doing, boost revenue. From a purely economic standpoint, it was like taking money out of your right pocket and putting it into your left: nothing really changed.
Here’s how it worked: Global Crossing sold large blocks of future network capacity to telecom customers. At the same time, the company purchased a similar dollar amount of capacity from these same customers. In other words, Global Crossing would sell capacity
to a customer and
simultaneously buy a similar amount of capacity
on a different network. This was a classic
boomerang
transaction. You can almost picture some Global Crossing executive telling the company’s customers, “You scratch my back, and I’ll scratch yours.”
So, what does this have to do with cash flow? Well, Global Crossing recorded these boomerang transactions in a way that artificially inflated CFFO. The company recorded the cash that it received from its customers in these transactions as an Operating inflow; however, the cash that it paid to the same customers was recorded as an Investing outflow. Essentially, Global Crossing inflated cash flow from operating activities by depressing cash flow from investing activities. This allowed the company to show strong CFFO that clearly was well in excess of the economic reality of the transaction. It mattered little that the overstated CFFO was offset by understated cash from investing activities, because
CFFO was the key cash flow metric on which investors were focused
. Did we mention the word
chutzpah
before?
Be on the Lookout for Boomerang Transactions.
These are very sneaky transactions that make you wonder about the economic substance of the arrangements. Diligent investors should be able to detect these transactions most of the time; look for disclosure of them in 10-Q and 10-K filings, but don’t expect that companies will use the term boomerang. Of course, companies will make investors work to find them and certainly will not present them on a silver platter. However there are often plenty of details about these transactions, particularly when they are substantial in size. Consider Global Crossing’s disclosure of its boomerang transactions in its March 2001 10-Q filing:
DISCLOSURE OF BOOMERANG TRANSACTIONS IN
GLOBAL CROSSING’S MARCH 2001 10-Q FILING
Page 11: For the March quarter, $375 in consideration, which is included in the $441 of Recurring Adjusted EBITDA below and in the $1,613 of cash revenue above,
was received from significant Carrier customers who signed contracts during the quarter to purchase $500 of capacity on the Global Crossing Network, and to whom the Company made substantial capital commitments during the quarter
. [Italics added for emphasis.]
Page 16: During the quarter,
the Company also entered into several agreements with various Carrier customers for the purchase of capacity and co-location space.
These transactions were implemented in order to acquire cost-effective local network expansions; to provide for cost-effective alternatives to new construction in certain markets in which the Company anticipates shortages of capacity; and to provide additional levels of physical diversity in the network as the Company implements its global mesh architecture.
These new capital commitments total an estimated $625
, including the cost of the possible construction of the Caribbean system previously mentioned. [Italics added for emphasis.]
This disclosure alone should have spooked investors. On page 11, Global Crossing discloses that $375 million of its $441 million in EBITDA (earnings before interest, taxes, depreciation, and amortization) came from sales to customers “to whom the Company made substantial capital commitments during the quarter.” Page 16 reminds readers that Global Crossing purchased capacity from customers and states that “new capital commitments total an estimated $625 million.”
Raise Your Antennae When You See a Boomerang Transaction
. Once you identify a boomerang transaction, it is imperative that you dig around and understand the true economics of the arrangement. Look for further disclosure. Call the company and have it explain the arrangement to you. Assess the economics of the transaction and understand how it contributes to the company’s results. Consider whether the company has been deliberately avoiding or complicating the disclosure—it may not want you to understand how its boomerang transactions work. If you cannot get comfortable with a boomerang transaction, steer clear of the company.
Key Metrics Shenanigans
. You may be wondering about the odd metrics that Global Crossing highlighted in the excerpts shown: “cash revenue” and “recurring adjusted EBITDA.” The company used these metrics in its communications with investors and advertised them as being better performance measures than GAAP (generally accepted accounting principles) revenue and earnings. As you might imagine, these metrics were defined in such a way as to circumvent GAAP. The definitions allowed Global Crossing to take credit for cash received in these boomerang transactions that could not legitimately be recognized as revenue until far in the future. The whole concept of management’s deliberately sidestepping GAAP to mislead investors is quite alarming and very important to understand. We will pick up on this topic and discuss it much more thoroughly in Part 4, “Key Metrics Shenanigans.”
2. Improperly Capitalizing Normal Operating Costs
Recording normal operating costs as an asset rather than as an expense sounds simple, and frankly, it is quite easy to do. However, it is one of the scariest and most lethal shenanigans out there. Why? Because it is a simple sleight of hand that does more than just embellish earnings—it inflates operating cash flow as well.
Tip:
If you suspect a company of receiving an earnings benefit from improper capitalization, don’t forget that there may be a boost to operating cash flow as well.
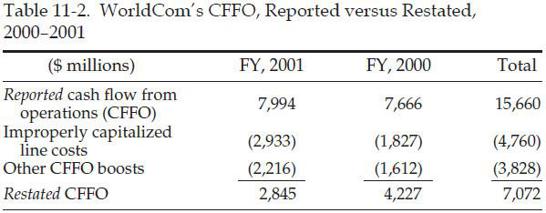
It certainly is no coincidence that WorldCom, the perpetrator of one of the largest and most shocking accounting frauds in history, was a purveyor of this particular brand of snake oil. By classifying billions of dollars of normal operating costs as capital equipment purchases, WorldCom not only artificially inflated its profits, but it also overstated its CFFO.
Recording Normal Operating Costs as a Capital Asset Rather Than as an Expense
Recall our discussion of how WorldCom improperly inflated its earnings by recording its line costs (a clear operating expense) as an asset rather than as an expense? This simple tactic helped the company portray itself as a profitable company rather than tell investors that trouble was stirring.
This move also allowed WorldCom to present strong operating cash flow. Purchases of capital assets (called “capital expenditures”) are classified on the Statement of Cash Flows as Investing activities. By classifying line costs as a capital asset, WorldCom shifted a very large cash outflow from the Operating to the Investing section.
This line cost scheme artificially inflated WorldCom’s CFFO by nearly $5 billion in 2000 and 2001, according to the company’s restatement. Together with other improperly capitalized costs and CFFO boosts, WorldCom’s operating cash flow was overstated by a whopping $8.588 billion over these two years (as shown in Table 11-2, the difference between $15.660 reported and the $7.072 restated).
In EM Shenanigan No. 4, we discussed several ways to identify companies that are engaging in aggressive capitalization. Dishonest company executives may find ways to improperly capitalize any normal operating cost; however, the most common ones are generally those related to long-term arrangements, such as research and development, labor and overhead related to a long-term project, software development, and costs to win contracts or customers. Monitor these accounts for the best chance of spotting aggressive capitalization.
Tip:
Rapidly growing fixed asset accounts or “soft” asset accounts (e.g., “other assets”) may be a sign of aggressive capitalization. Create a quarterly common-size Balance Sheet (i.e., calculate all assets and liabilities as a percentage of total assets) to help you quickly identify assets that are growing faster than the rest of the Balance Sheet.
Pay Attention to Free Cash Flow as Well.
When a company improperly records costs as an asset instead of an expense, CFFO will be overstated. However, as we discussed in Chapter 1, free cash flow may not be affected because it is a measure of cash flow
after
capital expenditures.