Financial Shenanigans: How to Detect Accounting Gimmicks & Fraud in Financial Reports, 3rd Edition (43 page)
Authors: Howard Schilit,Jeremy Perler
Tags: #Business & Economics, #Accounting & Finance, #Nonfiction, #Reference, #Mathematics, #Management

Pretending That One-Time Gains Are Recurring in Nature.
General Motors (GM) recorded a $259 million after-tax gain on the sale of an equity interest in a regional homebuilder in June 2006. Normally, GM removes any one-time gains or losses when presenting “adjusted income” in its earnings releases. Indeed, in the very same quarter, GM removed from adjusted income a gain on the sale of a different equity investment. Curiously, GM management decided that the gain on the homebuilder investment (which accounted for more than 20 percent of adjusted income) would not be excluded.
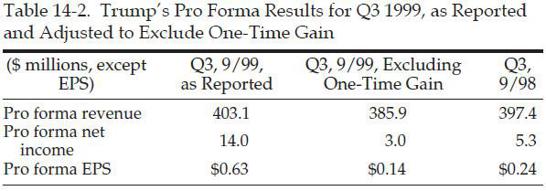
Trump Hotels & Casino Resorts also chose not to remove large nonrecurring gains from its adjusted income. Trump opened an All Star Café in its Atlantic City Taj Mahal Casino in 1997. All Star Café signed a 20-year lease; however, just two years later, its parent company (Planet Hollywood) went bankrupt. As a result, the lease was terminated, and all of the sports memorabilia and real estate improvements in the All Star Café became the property of Trump. Trump valued this property at $17 million and, in September 1999, recorded a one-time gain. (Shockingly, Trump put this gain in revenue!) When releasing its earnings results to Wall Street, however, Trump conveniently forgot to tell investors about this one-time benefit and failed to remove it from its pro forma numbers. As shown in Table 14-2, had Trump been more truthful in communicating with its investors and reported an honest measure of pro forma results, the company would have reported declines in both earnings and revenue, in contrast to the reported growth in both metrics.
Changing the Definition of Adjusted Earnings
. While Openwave Systems was accelerating its revenue recognition by changing its accounting policies (as discussed in Chapter 3), the company also quietly played around with its earnings metric of choice, “non-GAAP net income.” In late 2005, Openwave changed its definition of non-GAAP net income twice in two consecutive quarters. In the September 2005 quarter, Openwave began excluding expenses for restricted stock grants from its non-GAAP net income. According to a CFRA report in November 2005, this change added $0.04 to Openwave’s earnings, without which the company would have missed Wall Street’s expectations. Then, the very next quarter, Openwave changed the definition again, this time to exclude acquisition-related hedging costs from non-GAAP net income. The two changes combined to add $0.04 to earnings in the December quarter as well.
3. Highlighting a Misleading Metric as a Surrogate for Cash Flow
Non-GAAP cash flow metrics are less common than non-GAAP revenue and earnings disclosures; however, they do exist. Sometimes companies create a pro forma cash flow metric in order to exclude a nonrecurring activity, such as a large litigation settlement. However, other times, companies may be looking to artificially enhance their cash-generation profile.
“Cash Earnings” and EBITDA Are Not Cash Flow Metrics
Companies sometimes present metrics like “cash earnings” or “cash EBITDA” (as we just saw with Global Crossing). Do not confuse these metrics with substitutes for cash flow! Many companies and investors alike believe that these metrics (as well as plain old EBITDA) are good surrogates for cash flow simply because the calculation includes the adding back of noncash expenses such as depreciation. As you surely know by now, a company’s cash flow consists of much more than just net income plus noncash expenses. Calculating it in this way is really just an abuse of using the indirect method of developing the Statement of Cash Flows (SCF) (refer back to our discussion of cash flow presentation in the Part 3 introduction). Ignoring working capital changes when calculating cash flow will provide you with a fictional portrait of a company’s cash-generation abilities, in the same way that ignoring accruals for expenses such as bad debts, impairments, and warranty expenses will give you an illusory sense of profitability. In reality, metrics such as EBITDA and cash earnings are poor representations of performance.
Moreover, for capital-intensive businesses, EBITDA is often an illusory measure of performance and profitability because all of the major capital costs run through the Statement of Income as depreciation, and therefore are excluded from EBITDA. Some companies abuse the investment community’s acceptance of EBITDA and use the metric even though it is completely unwarranted. For example, rent-to-own retailer Rent-A-Center, Inc., purchases inventory (such as furniture and home electronics) and then rents the merchandise to customers for a monthly fee. Rent-A-Center records the rental fees as revenue, and the rental merchandise is depreciated over the rental life and recorded as “cost of rentals” on the Statement of Income (similar to cost of goods sold). However, when presenting its EBITDA, the company excludes the impact of these costs because they can be considered depreciation. We find it completely inappropriate to exclude these costs from any legitimate measure of profitability, since they are indeed the cost of inventory.
Non-GAAP Cash Flow Metrics Put There to Confuse
In Chapter 10, “CF Shenanigan No. 1: Shifting Financing Cash Inflows to the Operating Section,” we discussed how our friends at Delphi Corp. improperly recorded a loan from the bank as the sale of inventory, and in doing so boosted cash flow from operations (CFFO) by $200 million in 2000. Well, management at Delphi also liked to mislead investors by presenting tricky cash flow metrics.
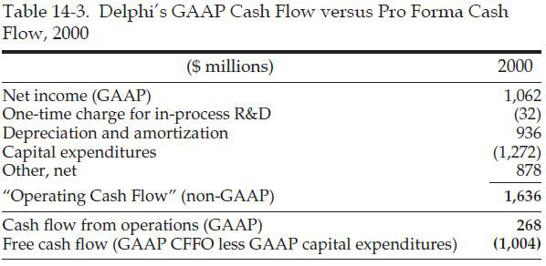
For example, Delphi routinely talked about and headlined its “Operating Cash Flow” in its earnings releases. No doubt, many people thought that Delphi was discussing its CFFO; however, this was not the case. “Operating Cash Flow” was actually Delphi’s deceptively named surrogate for GAAP cash flow from operations. Since the name is so close to its GAAP compadre, you can imagine how many investors were confused into thinking that this pro forma metric was Delphi’s actual CFFO. In truth, this surrogate barely resembled GAAP cash flow from operations. As shown in Table 14-3, it was calculated as net income plus depreciation and other noncash charges
minus
capital expenditures
plus
some huge mystery item labeled “other.”
We mentioned earlier that in 2000, Delphi’s actual CFFO (as reported on the SCF) was $268 million, but its self-defined “Operating Cash Flow” (as presented in the earnings release) was $1.636 billion—an astonishing differential of almost $1.4 billion. Since this cash flow surrogate includes the impact of capital expenditures, it may be more relevant to compare it to Delphi’s free cash flow (CFFO less capital expenditures) of negative $1.0 billion—bringing our differential to an outrageous $2.6 billion. (Oh, by the way, that $268 million in CFFO reported on the SCF was actually only $68 million if you exclude the sham sale of inventory that we discussed in Chapter 10.)
In 2003, Delphi was still up to the same tricks, but the company was now showing a reconciliation between its “Operating Cash Flow” and CFFO as reported on the Statement of Cash Flows. Delphi’s “Operating Cash Flow” was $1.2 billion in 2003, versus $737 million in CFFO and
negative
$268 million in free cash flow. As shown in Table 14-4, the primary differences included routine operating uses of cash flow, including pension plan contributions, payments to employees, and a decline in the sales of accounts receivable.

Any serious investor who looked at this presentation would be aghast at seeing such normal operating expenditures excluded from the calculation of “Operating Cash Flow.” The old adage “where there’s smoke, there’s fire” is very applicable when searching for shenanigans. Delphi’s ridiculous cash flow surrogate deception was the smoke. The fraudulent revenue and cash flow was the fire.
Funds from Operations
The real estate investment trust (REIT) industry uses the funds from operations (FFO) metric as a standard for measuring company performance. While this metric was not promulgated by GAAP, it is widely viewed as a gauge of a REIT’s ability to generate cash flow and is often viewed as being more useful than traditional GAAP earnings or cash flow measures. In order to promote the consistency and legitimacy of this performance metric, the industry’s main trade group, the National Association of Real Estate Investment Trusts (NAREIT), laid out a strict definition of FFO. NAREIT defined FFO to be net income excluding depreciation, gains or losses from the sale of property, and income from unconsolidated joint ventures.
Some companies, however, are not really interested in conforming to voluntary industry standards, especially when they benefit from going rogue. American Financial Realty, for example, shunned the industry standard definition in 2003 and instead used its own more favorable definition, which, of course, inflated performance and helped management reach its bonus targets. As shown in the accompanying box, the primary difference between American Financial Realty’s definition and the industry standard was that the company decided to include its gains from the sale of property, whereas NAREIT explicitly prohibits this. Had American Financial Realty excluded these gains from the calculation as dictated by the industry definition, the company’s 2003 FFO would have been cut by nearly half.
Investors could quite easily adjust American Financial Realty’s FFO to bring it in line with the industry standard, and thus allow for comparisons with other companies. The tricky part, however, would be to know that this needed to be done. By now you should know that any time a company reports an important non-GAAP metric, you need to read and monitor the definition to ensure that you understand exactly what information that metric conveys.
FUNDS FROM OPERATIONS AMERICAN FINANCIAL REALITY
VERSUS NAREIT’S INDUSTRY STANDARD
NAREIT Industry Standard Definition of FFO:
Funds from Operations means net income (computed in accordance with generally accepted accounting principles) excluding gains (or losses) from sales of property plus depreciation and amortization and after adjustments for unconsolidated partnerships and joint ventures. Adjustments for unconsolidated partnerships and joint ventures will be calculated to reflect funds from operations on the same basis.
American financial realty’s Definition of FFO in Its 2003 10K:
We define FFO as net income (loss) before minority interest in our operating partnership (computed in accordance with generally accepted accounting principles or GAAP) excluding gains (or losses) from debt restructuring including gains (or losses) on sales of property plus real estate related depreciation and amortization and after adjustments for unconsolidated partnerships and joint ventures.