Financial Shenanigans: How to Detect Accounting Gimmicks & Fraud in Financial Reports, 3rd Edition (40 page)
Authors: Howard Schilit,Jeremy Perler
Tags: #Business & Economics, #Accounting & Finance, #Nonfiction, #Reference, #Mathematics, #Management

• Disclosure about the timing of inventory purchases
• Dramatic improvements in CFFO
• CFFO benefit from one-time items
Looking Ahead
Chapter 13 completes our unit on Cash Flow Shenanigans—techniques to inflate operating cash flows. In aggregate, Parts 2 and 3 focused on gimmicks to produce results that will impress investors with either higher reported earnings or higher operating cash flows. Well, if those doctored-up results still have not dazzled investors, some eager-to-please companies have developed a new group of tricks that involve the use of
Key Metrics
. We will share some of those deep dark secrets in Part 4.
PART FOUR:
Key Metrics Shenanigans
We have climbed the first two mountains in our quest to conquer financial shenanigans, with one big climb still to come. Until now, we have focused on assessing the performance of companies using two separate metrics: earnings and cash flow.
Part 2, “Earnings Manipulation Shenanigans,” discussed techniques for manipulating accrual-based performance numbers by playing around with revenue and expenses or shifting them to the wrong section or the wrong financial statement entirely. We pointed out the limitations of accrual-based performance metrics like net income, and suggested that investors should expand their analysis to evaluate cash flow performance metrics, such as cash flow from operations and free cash flow.
Part 3, “Cash Flow Shenanigans,” addressed a relatively new and troubling phenomenon: management’s propensity to use Cash Flow Shenanigans to give a company the misleading appearance of having strong operating and free cash flow. We also presented strategies that investors can use to detect Cash Flow Shenanigans and to adjust the reported numbers to remove these unsustainable boosts.
At this point, you can take a deep breath and feel good about your ability to evaluate a company’s “economic” performance through accrual-based (Statement of Income) and cash-based (Statement of Cash Flows) models, even when management employs shenanigans to hide the true story from investors. You have also learned how to uncover dozens of tricks used by management.
However, your quest is not yet over. In Part 4, “Key Metrics Shenanigans,” we discuss the importance of using other “key metrics” to evaluate a company’s performance and economic health, and we expose tricks that companies could use to cloud the picture and mislead investors.
Two Key Metrics Shenanigans
Chapter 14 KM No. 1: Showcasing Misleading Metrics That Overstate Performance
Chapter 15 KM No. 2: Distorting Balance Sheet Metrics to Avoid Showing Deterioration
Successful investing requires a rigorous analysis of a broad array of financial performance and economic health metrics for a company. Some pertinent information can be found fairly easily by reading the Statement of Income, Statement of Cash Flows, and Balance Sheet. Other equally important information may be gleaned from supplementary documents (i.e., company press releases, earnings announcements, footnotes, and Management Discussion and Analysis included with the financial reports). In addition, investors should study the financial reporting of competitors, not only to compare performance and health measures, but also to assess the application of accounting standards and disclosure.
Now you have reams of data to read and analyze. Great, but before digging in, remember to ask these two important questions.
- What are the
best metrics of that specific company’s performance
, and does management highlight, ignore, distort, or even make up its own version of these metrics?
- What are the
best metrics that would reveal a specific company’s deteriorating economic health
, and does management highlight, ignore, distort, or even make up its own version of these metrics?
Investors are increasingly evaluating companies using both performance- and economic health–related metrics. Not surprisingly, with so much riding on pleasing investors, management is providing much more information, but it often tries to camouflage any deterioration in the business. We label this group of tricks Key Metrics (KM) Shenanigans. They can be grouped as (1) performance metrics and (2) economic health metrics.
Evaluation of Financial Performance and Economic Health Metrics
For a given industry or company, start out by learning the very best metrics for evaluating economic performance and health—both past and expected in the near-term. (Longer-term performance predictions tend to be woefully inaccurate and provide little value for investors.) When evaluating metrics, create your own grading chart similar to the one shown in Table P4-1.
Let’s consider a subscription-based business, an industry that we know quite well. Start with the traditional performance metrics reported on the Statement of Income (revenue, operating earnings, net income, and earnings per share [EPS]) and on the Statement of Cash Flows (cash flow from operations and free cash flow). Nothing would be wrong with any of these—assuming that
no
Earnings Manipulation or Cash Flow Shenanigans exist. But this list would lack at least one enormously important piece of information—the most recent trends in the business. Have recent subscriber counts been falling? Has the amount of revenue earned from each subscriber declined over the last few quarters? Since both accrual-based revenue and cash flow–based CFFO focus on
past, not expected, revenue or cash flows
, investors should be keen on receiving and evaluating subscriber-based metrics. This information would be extraordinarily valuable.
Grade A
for its benefit for investors.
In general, most revelations provided in the supplementary information would fit into the middle categories, ranging from useful (B grade) to of little additional value (C grade).
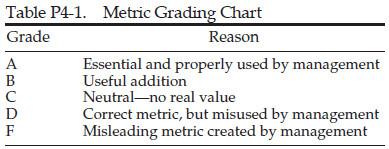
Only those metrics in the two lowest grade categories can be categorized as shenanigans: a grade of D is given to an otherwise-appropriate metric chosen by management that is being used out of context, and a grade of F is given to a misleading metric that was made up in order to dress up results.
Categories of Performance Metrics
Think of our traditional financial performance metrics (e.g., revenue, net income, and cash flow) as being similar to the box score of yesterday’s baseball game. While the information reflects past performance, it can often provide very relevant indicators about the strength of the team and in many cases can shed light on what to expect tomorrow. However, other supplementary pieces of information exist or can be derived that are excluded from the box score, yet would be essential for an analysis of the team. As baseball historian Bill James realized when he pioneered a new form of baseball statistical analysis (and as Michael Lewis illustrated beautifully in
Moneyball
), many unconventional baseball statistics can be more revealing than the traditional metrics listed in the box score.
The best supplementary financial performance metrics should provide additional insight into a company’s recent operational performance (good or bad) to go with that conveyed by traditional financial statement metrics based on generally accepted accounting principles (GAAP). We highlight ways in which management presents (1) surrogates for revenue, (2) surrogates for earnings, and (3) surrogates for cash flow.
Surrogates for Revenue
. Management often tries to clarify and expand its disclosures on customer sales and provide insight into future demand and pricing power. A broadcast cable operator, for example, may disclose its subscriber count, an airline its “load factor” (the percentage of total seats filled), an Internet portal its number of “paid clicks,” and a hotel operator its “revenue per available room.” Industries and companies often produce their own unique metrics to help investors get a better grasp of a company’s performance. Some common metrics that would be considered revenue surrogates include same-store sales, backlog, bookings, subscriber count, average revenue per customer, and organic revenue growth.
Surrogates for Earnings.
Management sometimes tries to present a “cleaner” version of earnings in order to convey the true operating performance of the business. A chemical manufacturer, for example, may remove a large one-time gain from selling real estate when presenting earnings in order to convey its performance in a way that is comparable with that used in past and future periods. Companies often have similar names for these non-GAAP earnings surrogates, even though each company may define them differently. Some common metrics used include pro forma earnings, EBITDA (earnings before interest, taxes, depreciation, and amortization), non-GAAP earnings, constant-currency earnings, and organic earnings growth.
Surrogates for Cash Flow.
As with earnings surrogates, management may also try to present a “cleaner” version of its cash flow, although this may be a bit trickier and is often more controversial. For example, a retail chain may present cash flow excluding a substantial one-time cash payment for a legal settlement. Some common metrics used include pro forma operating cash flow, non-GAAP operating cash flow, free cash flow, cash earnings, cash revenue, and funds from operations.
Accounting Capsule: Pro Forma Numbers—
“Apples-to-Apples” Comparison
Whenever management makes significant accounting or classification changes or even makes an acquisition, comparisons with earlier period results may become difficult, if not impossible, for investors to make. Thus, to provide an apples-to-apples comparison for investors, companies include pro forma (as if) adjusted financial statements as supplementary information.
For example, let’s assume that a company changes its revenue recognition policy. The GAAP-based numbers would naturally show current-period results with the new accounting policy but would still report alongside them the earlier-period results using the old accounting policy, no doubt creating confusion. To help investors make a sensible comparison, a pro forma presentation would include the results of both periods under the new revenue recognition policy.
Categories of Economic Health Metrics
Continuing our baseball analogy, if analyzing performance metrics can be considered akin to reviewing yesterday’s
box score
, then analyzing economic health metrics would be similar to reviewing today’s baseball
standings
that show a team’s cumulative performance (wins and losses for the season). The Balance Sheet can be thought of as a company’s present, up-to-the-minute record that reflects its cumulative performance since its inception. (For some longstanding companies, that could be a very long “season.”) While the Balance Sheet reflects the accumulation of all past performance, it can shed light on what to expect tomorrow. A baseball team that is at the top of the win-loss standings and is leading the league in runs scored for the season can normally be considered to be in excellent health. On the opposite side of the spectrum, a team that is near the bottom of the standings, has a miserable cumulative batting average, and is letting through more runs than any other team can be considered to be in poor health and relatively unstable.
As with the approach described for performance, for a given industry, start out by learning the very best metrics for evaluating economic health and stability—both past and expected in the near term. And, as with performance evaluation, when evaluating economic health metrics, use the grading chart shown in Table P4-1.
The best supplementary economic health metrics should provide added insight into the strength of a company’s Balance Sheet, including how well the company
(1)
manages customer collections
(2)
maintains prudent inventory levels
(3)
maintains financial assets at their appropriate value
(4)
keeps liquidity and solvency risks in check to prevent a devastating cash crunch