Financial Shenanigans: How to Detect Accounting Gimmicks & Fraud in Financial Reports, 3rd Edition (39 page)
Authors: Howard Schilit,Jeremy Perler
Tags: #Business & Economics, #Accounting & Finance, #Nonfiction, #Reference, #Mathematics, #Management

2. Boosting CFFO by Collecting from Customers More Quickly
Another way in which companies can generate a nonrecurring CFFO boost would be to convince customers to pay them more quickly. This certainly would not be considered a bad thing, and it may even speak well of a company’s significant leverage over its customers. However, as in our discussion about stretching out payables, companies cannot continue to collect at a faster and faster rate every quarter in perpetuity. As a result, the growth in CFFO that results from accelerated collections should be deemed unsustainable.
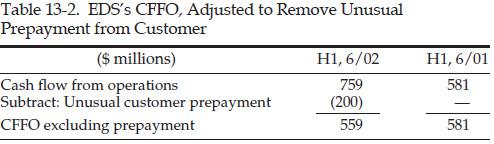
Take, for example, technology services provider EDS (now part of Hewlett-Packard). In 2002, EDS renegotiated a contract with an existing customer and received up front a $200 million prepayment for services that the company was scheduled to provide over the next two years. Clearly, prepayments from customers are not a bad thing; in fact, most companies would love to be in this position.
However, EDS failed to level with investors and tell them that this inflow should be considered just an accelerated payment and was unsustainable in nature. It should have explained that the boost in CFFO was ephemeral and that this unprecedented transaction was the primary driver of its cash flow growth. Indeed, the $200 million prepayment accounted for 26 percent of CFFO in the first half of 2002 and more than all of its growth over the prior year. (See Table 13-2.) Given how closely investors followed EDS’s cash flow, the SEC found the company’s disclosure to be inadequate.
Watch for New Disclosure about Prepayments.
EDS did give investors a hint that it was receiving more prepayments when discussing cash flow growth in its June 2002 10-Q. However, the disclosure was very limited (shown in the following box), so much so that the SEC deemed it inadequate given the magnitude of the prepayment.
EDS’S 10-Q DISCLOSURE WAS SPARSE
This increase of receivables was more than offset by an increase in deferred revenue due to an
increase in customer prepayments
as well as lower payments on current liabilities. [Italics added for emphasis.]
Watch for Elaborate Strategies to Influence the Timing of Cash Flow.
Warning signs about accelerated collections could certainly have been spotted at Silicon Graphics several quarters before its May 2006 bankruptcy. The company was burdened with debt and did everything in its power to portray to investors a stronger liquidity position. Unlike companies that may use a position of power with customers to accelerate collections, Silicon Graphics’ diminished health compelled it to offer discounts to induce early payments. Consider the disclosure shown here from the company’s September 2005 10-Q.
Also, notice other cash management tricks that Silicon Graphics was playing (holding vendor payments and buying inventory at the end of the quarter) to show cash on its Balance Sheet at its highest point on the last day of the quarter. Diligent investors would have noticed these issues and known that disaster was not far away.
SILICON GRAPHICS INC. SEPTEMBER 2005 10-Q
During the first quarter of fiscal 2006, we maintained our focus on customer cash collections and
offered certain customers discounted terms for early payment
. As a result, our days’ sales outstanding were 37 days at September 30, 2005, down from 49 days at June 24, 2005 and 39 days at September 24, 2004. We expect that days’ sales outstanding will be more in line with historical levels in the second quarter of fiscal 2006. . . .
. . . We also experience significant intra-quarter fluctuations in our cash levels, with the result that
our cash balances are generally at their highest point at the end of each quarter and significantly lower at other times.
These intra-quarter fluctuations reflect our business cycle, with significant requirements for inventory purchases in the early part of the quarter and most sales closing in the last few weeks of the quarter.
To maintain adequate levels of unrestricted cash within each quarter, we offer certain customers discounted terms for early payment and hold certain vendor payments to the beginning of the following quarter.
[Italics added for emphasis.]
Be Wary of Dramatic Improvements in CFFO.
Telecom equipment manufacturer UTStarcom reported markedly improved CFFO in early 2008. After a dismal 2007, in which it logged four consecutive quarters of negative CFFO (for a total cash burn of $218 million), UTStarcom suddenly reported positive cash flow of $97 million in March 2008. Investors could have readily noticed that the cash flow turnaround resulted from a number of particularly aggressive working capital actions. A quick peek at the Balance Sheet revealed a $65 million drop in accounts receivable and a $66 million increase in accounts payable. The 10-Q gave more insight and mentioned one of those “management decisions” we warned you about in CF Shenanigan No. 1 with the infamous Computer Associates. (See the accompanying disclosure from UTStarcom’s March 2008 10-Q.)
UTSTARCOM’S 10-Q DISCLOSURE TOLD THE STORY
The decrease in accounts receivable was primarily due to strong customer collections in our PCD business segment. The increase in accounts payable was due to the high level of inventory purchasing activity late into the first quarter of 2008, as well as
a management decision to forgo early payment discounts with a significant vendor.
[Italics added for emphasis.]
UTStarcom proceeded to report negative operating cash flow throughout the rest of 2008. Despite the $97 million in positive CFFO during the first quarter, the company ended the year in a hole, having burned through $55 million in operating cash flow.
Tip:
While many investors are pleased when management says that it is “aggressively managing working capital,” you should take this as a warning sign that recent CFFO growth may not be sustainable.
3. Boosting CFFO by Purchasing Less Inventory
Home Depot, as you recall, received an unsustainable CFFO boost in 2001 from stretching out payments to vendors. Well, the company had another CFFO-improving trick up its sleeve: purchasing less inventory.
Earlier in this chapter, we discussed how Bob Nardelli doubled Home Depot’s operating cash flow in his first year on the job by stretching out vendor payables and reducing the amount of inventory at each store. Home Depot lowered its inventory levels simply by not restocking shelves after goods had been sold. In other words, the company just did not purchase as much inventory from vendors as in previous years.
If you recall from our earlier discussion of Home Depot, stretching out vendor payments produced a large positive “swing” on the Statement of Cash Flows. In the same way, failing to restock inventory levels would also provide an unsustainable boost to CFFO. Let’s revisit Home Depot’s Statement of Cash Flows in Table 13-1 to see the inventory swing from an outflow of $1.1 billion in 2000 to an outflow of only $166 million in 2001 (and then back to an outflow of $1.6 billion in 2002 as the benefit reversed).
To be fair, Home Depot was very clear in its disclosure under the “Liquidity and Capital Resources” section of its 10-K filing, stating that CFFO growth primarily had been driven by an extension of payables and a decrease in inventory per store (see the disclosure in the accompanying box). Investors would be well served by reading through the entire document because such important nuggets of information can be found deep inside the filing.
HOME DEPOT 2/2002 10-K
For fiscal 2001, cash provided by operations increased to $6.0 billion from $2.8 billion in fiscal 2000. The increase was primarily due to significant growth in days payable outstanding from 23 days at the end of fiscal 2000 to 34 days at the end of fiscal 2001, a 12.7% decrease in average inventory per store as of the end of fiscal 2001 and increased operating income.
In the next year, Home Depot did not benefit from a decrease in inventory. However, it provided a good spin on this in the “Liquidity and Capital Resources” section, suggesting that it had pared back inventory too much in the previous year:
HOME DEPOT 2/2003 10-K
For fiscal 2002, cash provided by operations decreased to $4.8 billion from $6.0 billion in fiscal 2001. The decrease was primarily due to a
7.9% increase in average inventory per store resulting from our focus on improving our in-stock position in fiscal 2002
. [Italics added for emphasis.]
Tip:
Buried in the 10-Qs and 10-Ks is some extra insight about the drivers of cash flow. It is one of the most important sections of the filing, but many investors don’t know it exists. To find it, turn to the Management Discussion & Analysis (MD&A)—near the back is a section often called “Liquidity and Capital Resources.” This section is a “must-read” for every company you analyze.
Watch for Disclosure about Timing of Inventory Purchases within Each Quarter
. Silicon Graphics purchased inventory at the very beginning of each quarter and then worked it down as much as possible by the end of the period, only to purchase more once the quarter closed. (See the 10-Q disclosure in our earlier discussion on Silicon Graphics.) As with its receivables and payables management schemes, the company used this strategy to manipulate investor perceptions that its liquidity was adequate when, in reality, it was teetering on the brink of bankruptcy.
4. Boosting CFFO with One-Time Benefits
Microsoft Corp. doled out billions of dollars to settle antitrust litigation in recent years. One of the largest recipients, Sun Microsystems, pocketed nearly $2 billion from Microsoft in 2004 ($1.6 billion of which was immediately recognized as income). Sun presented this large one-time item in plain view on its Statement of Income, listing it separately as “settlement income.” Sun’s disclosure made it very easy for investors to understand that the income from this settlement was nonrecurring and unrelated to its normal operations; it was reported “below the line” as nonoperating income.
Sun’s Statement of Cash Flows, however, was less clear. The company recorded the $2 billion in cash as an Operating inflow (as is appropriate under the indirect method), but it was not listed separately on the SCF; rather, it was simply bundled with net income. As you would imagine, a $2 billion settlement was quite material to Sun’s results—CFFO for all of 2004 was $2.2 billion, up from $1.0 billion in 2003. Diligent investors would have noticed this settlement reflected on the Statement of Income and should have immediately realized that it was an unsustainable source of CFFO.
Accounting Capsule: The Meaning of “Operating”
The term
operating
means different things when it comes to “operating cash flow” and “operating income.” For example, taxes, interest, and large one-time events are considered to be a part of operating cash flow but not of operating income.
Tip:
Nonrecurring boosts to CFFO are often not plainly disclosed on the Statement of Cash Flows. Whenever you spot any kind of one-time earnings benefit, ask yourself: “How does this boost affect the Statement of Cash Flows?”
Looking Back
Warning Signs: Boosting Operating Cash Flow Using Unsustainable Activities
• Boosting CFFO by paying vendors more slowly
• Accounts payable increasing faster than cost of goods sold
• Increases in other payables accounts
• Large positive swings on the Statement of Cash Flows
• Evidence of accounts payable financing
• New disclosure about prepayments
• Offering customers incentives to pay invoices early
• Boosting CFFO by purchasing less inventory