How We Know What Isn't So (7 page)
Read How We Know What Isn't So Online
Authors: Thomas Gilovich
Tags: #Psychology, #Developmental, #Child, #Social Psychology, #Personality, #Self-Help, #Personal Growth, #General

Still further evidence that people tend to seek out confirmatory evidence comes from research that was designed to investigate a very different problem—namely, the psychological basis of perceived similarity.
12
As part of this research, one group of participants was asked which two countries are more similar to one another, East Germany and West Germany, or Sri Lanka and Nepal. Most of them said that East and West Germany are more similar. A second group of participants, however, was asked which two countries are more
different
from one another, East Germany and West Germany, or Sri Lanka and Nepal. The majority likewise said that East and West Germany are more dissimilar. This leads to the seemingly impossible conclusion that East and West Germany are both more similar and more dissimilar than Sri Lanka and Nepal. How can that be?
The accepted interpretation of these results is that judgments of similarity are primarily determined by features that two entities share. Because people know more about East and West Germany than they do about Sri Lanka and Nepal (people in the Western world, that is), they can think of more things they have in common, and so they seem more similar. Judgments of dissimilarity, on the other hand, are primarily determined by features that are
not
shared by the two entities—i.e., by those features that are
distinctive
to one or the other. Again, because people know more about East and West Germany than Sri Lanka and Nepal, it is easier to think of ways in which they differ from one another, and so they are seen as more dissimilar as well.
With respect to the focus of this chapter, it seems that once again people engage in a search for evidence that is biased toward confirmation. Asked to assess the similarity of two entities, people pay more attention to the ways in which they are similar than to the ways in which they differ. Asked to assess dissimilarity, they become more concerned with differences than with similarities. In other words, when testing a hypothesis of similarity, people look for evidence of similarity rather than dissimilarity, and when testing a hypothesis of dissimilarity, they do the opposite. The relationship one perceives between two entities, then, can vary with the precise form of the question that is asked.
The research described thus far indicates that we do not adequately assess the validity of our hypotheses or beliefs because we do not fully utilize all of the information available to us. As we shall see, this tendency is compounded by the fact that there are many times when important information is simply unavailable.
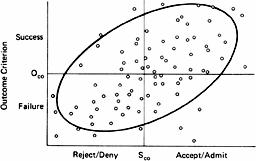
To make this clear, consider an expansion of the 2×2 table discussed earlier. In this expansion, depicted in
Figure 3.1
, the x-axis represents performance on some “selection” criterion and the y-axis represents performance on some “outcome” criterion. For example, the x and y axes could represent the performance of job applicants in interviews and their subsequent performance on the job, high-school students’ SAT scores and their college GPAs, or scientists’ grant-evaluation scores and the subsequent success of their research programs.
13
Each of the points in
Figure 3.1
represents an individual’s performance on the selection and outcome criteria. In this case, there is a substantial correlation between people’s performances on the two criteria, as seen by the lower-left to upper-right drift of the points (captured by the tilted ellipse). Note that some performances on the selection criterion are sufficiently high to warrant predictions of subsequent success and to earn admission to some special status—those who excel in an interview gain employment, and those who score high on the SAT are admitted to exclusive colleges. Similarly, some performances on the outcome criterion are sufficiently high that they are considered successes—new employees who work out well and contribute to the organization, or college students who study hard, get good grades, and contribute to the intellectual atmosphere of their colleges.
Figure 3.1
Initial Selection and Subsequent Performance
Selection Criterion
The vertical line at S
co
represents the cutoff between those scores on the selection criterion that warrant predictions of future success and those that warrant predictions of failure. The horizontal line at O
co
represents the cutoff between actual successes and failures. The four quadrants that emerge comprise the familiar 2×2 table that permits an assessment of whether predicted success or failure is related to actual success or failure. In other words, does the selection test predict actual performance? To answer this question, it is necessary to compare the success rate among those for whom success was predicted (the two quadrants on the right) with the success rate among those for whom it was not (the two on the left).
The important point here is that many times we
cannot
carry out such a comparison even if we appreciate how important such a comparison is. Those who do not score high enough on the selection criterion are not allowed to perform, and so we cannot determine how many of them would have succeeded. Those who create bad impressions in interviews do not land jobs, those with low SAT scores do not go to elite colleges, and those with poor grant scores, are confined to nickel-and-dime research. Without information about how members of the “rejected” group would have performed had they not been rejected, the only way to evaluate the effectiveness of the selection test is to look at the success rate among those who are “accepted”—a comparison that is inadequate to do the job. If the base rate of success is high—i.e., if there would have been a large number of successes even among those who fell below the cutoff on the selection criteria—one can erroneously conclude that the selection criterion is effective even if it is completely unrelated to performance. Such erroneous conclusions are particularly likely whenever the talent pool of applicants is sufficiently strong, so that nearly everyone—regardless of their performance on the selection criterion—would succeed. If only the best people apply to a company, school, or funding organization, the “gatekeepers” in such institutions are likely to look around at all of their successful selection decisions and conclude that their procedures for hiring employees, admitting students, and disseminating funds are extremely effective. However, without knowing more about how well the rejected applicants would have performed, such conclusions rest on shaky ground.
Another factor that can make a selection criterion appear spuriously effective is that the mere fact of being in the “accepted” group can give a person a competitive advantage over those who were rejected. Some of those who receive research grants go on to have more productive careers than some who were less fortunate, not because their research ideas were any better, but because the grant enabled them to examine their ideas more thoroughly. Some of the students who score well enough on the SAT to be admitted to a prestigious college go on to become professionally successful men and women partly because of the superior intellectual environment their high scores allowed them to experience.
The hazards of drawing conclusions solely from the performance of those in the accepted group can be seen most clearly by comparing
Figure 3.1
with
Figure 3.2
. In
Figure 3.1
the data from all four cells of the 2×2 table are presented—the subsequent performances of those who were accepted as well as the performances that
would have been turned in
by those below the cut-off had they not been rejected. Furthermore, because everyone in this depiction is “admitted,” there are no competitive advantages enjoyed by a subset of the population. In
Figure 3.2
, however, the picture is much different. In this, more realistic depiction, information about how well the rejected group would have performed is absent, so there is no baseline against which to evaluate the effectiveness of the selection criterion. In addition, the competitive advantage that stems from being in the accepted group serves to artificially raise each person’s score on the outcome criterion. This is depicted by the upward shift in all of the points (from the white to the black dots), and an upward shift in the half-ellipse that tracks these points.
The net effect of these two processes is that nearly all of the observations fall in the upper-right quadrant, representing predicted successes that are vindicated by actual success. The observations that might have fallen in the two lefthand quadrants are simply unavailable, and many of those that would have fallen in the lower-right area have been artificially shifted into the upper-right, success/success quadrant. In the specific case represented in
Figures 3.1
and
3.2
, the result is that an effective selection criterion appears to be even more effective than it actually is. In other cases, the same processes can make a completely worthless selection criterion appear to have some value.
The scheme depicted in
Figures 3.1
and
3.2
, it should be noted, also clarifies when decision makers will
avoid
making overly-optimistic assessments of their ability to make accurate selection decisions. In particular, decision makers may be immune to the “illusion of validity” in domains in which they are not shielded from the subsequent performances of those they rejected. Sometimes our decision to reject someone comes back to haunt us. Baseball executives who underestimate a player’s potential and trade him to another team do not remain blissfully unaware of their misjudgment: The mistake becomes apparent when the player returns as an opponent and torments his former team. Similarly, talent scouts in the music industry are often haunted by the meteoric rise to fame of someone they thought “didn’t have it.” Research has shown that decision-makers’ assessments of their abilities are fairly well-calibrated in domains such as these in which “the cream always rises to the top” and the decision maker becomes aware of his or her mistakes.
14
The scheme depicted in
Figures 3.1
and
3.2
is really quite general, and applies not only to the evaluation of selection criteria, but to the assessment of policy more generally. A fundamental difficulty with effective policy evaluation is that we rarely get to observe what would have happened if the policy had not been put into effect. Policies are not implemented as controlled experiments, but as concerted actions. Not knowing what would have happened under a different policy makes it enormously difficult to distinguish positive or negative outcomes from good or bad strategies. If the base rate of success is high, even a dubious strategy will seem wise; if the base rate is low, even the wisest strategy can seem foolish. Returning to baseball for just a moment, this idea explains why late-inning “relief” pitchers tend to make or break managers’ careers. If a manager without a good reliever goes to his bullpen late in the game and his team’s lead is squandered, the fans bemoan his decision to change pitchers. If, mindful of his ineffective bullpen, he leaves a tiring pitcher in the game too long and loses, he is criticized for that too. It is hard to look good when you only have two options and both of them are bad.
Figure 3.2
Information Commonly Available for Assessing the Relationship Between Initial Selection and Subsequent Performance
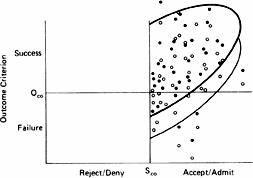
Selection Criterion
This idea is illustrated even more clearly by considering a specific policy that is widely viewed as a fiasco—the United States’ military intervention in Viet Nam. The actions taken there were clearly disastrous: After the loss of more than 50,000 American lives and incalculable devastation to Southeast Asia, Viet Nam now exists as a unified, communist country. However, it is interesting to speculate about what lessons we would have learned and whether we would have been any more pleased with the outcome had we employed a different strategy. At least from the standpoint of the Democratic Party that was then in power, a non-interventionist strategy might have been equally disastrous. A unified, communist regime would exist in Viet Nam, a Democratic administration would be saddled with the “loss” of Southeast Asia to go with the party’s earlier loss of China, the right wing in the United States would be enormously strengthened, and important lessons about the limits of our military power would not have been learned, leaving us to lose American lives in some other theater of the world. Had we pursued a non-interventionist strategy, in other words, we might be terribly dissatisfied with
that
outcome and wish we had acted more forcefully. Sometimes the deck is just stacked against us and any policy is likely to produce unsatisfactory results. That can be hard to see, however, when only one policy can be implemented.