How We Know What Isn't So (3 page)
Read How We Know What Isn't So Online
Authors: Thomas Gilovich
Tags: #Psychology, #Developmental, #Child, #Social Psychology, #Personality, #Self-Help, #Personal Growth, #General

We also examined each player’s performance record to determine whether the number of streaks of various lengths exceeded the number to be expected if individual shots were statistically independent. Were there more streaks of, say, 4, 5, or 6 hits in a row than chance would allow? Were there more, for example, than the number of streaks of 4, 5, or 6 heads in a row that one observes when flipping coins? The relevant statistical tests indicated that there was no such tendency. A variety of additional, more complicated, analyses led to the same conclusion: A player’s performance on a given shot is independent of his performance on previous shots. (It is interesting to note that an interview with eight members of the 76ers that year revealed that these very players believed that they tended to shoot in streaks.)
Table 2.1
Probability of Making a Shot Conditioned on the Outcome of Previous Shots for Nine Members of the 76ers
Player | P(x|ooo) | P(x|oo) | P(x|o) | P(x) | P(x|x) | P(x|xx) | P(x|xxx) | r |
|---|---|---|---|---|---|---|---|---|
C. Richardson | .50 | .47 | .56 | .50 | .49 | .50 | .48 | −.02 |
J. Erving | .52 | .51 | .51 | .52 | .53 | .52 | .48 | .02 |
L. Hollins | .50 | .49 | .46 | .46 | .46 | .46 | .32 | .00 |
M. Cheeks | .77 | .60 | .60 | .56 | .55 | .54 | .59 | −.04 |
C. Jones | .50 | .48 | .47 | .47 | .45 | .43 | .27 | −.02 |
A. Toney | .52 | .53 | .51 | .46 | .43 | .40 | .34 | −.08 |
B. Jones | .61 | .58 | .58 | .54 | .53 | .47 | .53 | −.05 |
S. Mix | .70 | .56 | .52 | .52 | .51 | .48 | .36 | −.02 |
D. Dawkins | .88 | .73 | .71 | .62 | .57 | .58 | .51 | −.14 |
Mean = | .56 | .53 | .54 | .52 | .51 | .50 | .46 | −.04 |
NOTE |
How can we reconcile the widespread belief in the hot hand with the startling disconfirmation provided by these data? Most people’s first response is to insist that the belief is valid and the data are not. The hot hand exists, the argument goes, it just did not show up in our sample of data. Perhaps it did not appear because being hot is perfectly compensated for by a hot player’s tendency to take more difficult shots or receive more attention by the defensive team. The hot hand may have been masked, in other words, by other phenomena that work in the opposite direction. To test such an alternative interpretation, one must examine players’ performance records when the difficulty of the shot and the amount of defensive pressure have been held constant. The most direct way of doing so is to examine players’ “free-throw” records—penalty shots taken in pairs from the same distance and without defensive pressure. If success promotes success, then we would expect a player’s shooting percentage on his second shot to be higher after making his first shot than after missing his first. It is not. Our analysis of two seasons of free-throw statistics by the Boston Celtics indicate that the outcomes of consecutive free throws are independent. On average, the players made 75% of their second free throws after making their first, and 75% after missing their first.
Still unconvinced, a number of people have tried to salvage their belief in the hot hand by suggesting that perhaps we have not adequately captured what is meant by the term (our initial survey results notwithstanding). Perhaps players’ hits and misses do not cluster together more than do heads and tails, but, unlike coin flips, the player can predict in advance whether he is likely to make the next shot. In other words, maybe the hot hand really refers to the predictability of hits and misses rather than the clustering together of success with success and failure with failure.
This too was tested and found wanting. We asked a group of college basketball players to take 100 shots from along an arc that was everywhere an equal distance from the basket. Before each shot the players chose either a risky or conservative bet corresponding to whether they felt more or less likely to make their upcoming shot. The results indicated that the players believed that they shot in streaks: They tended to make risky bets after hitting their previous shot and conservative bets after missing their previous shot. However, there was no correlation between the outcome of consecutive shots, and hence no connection between their bets and the outcome of the next shot. In other words, not only do players fail to shoot in streaks, but they cannot predict in advance whether they are likely to make a given shot. Even according to this revised definition, the hot hand does not seem to exist.
Why Players Seem to Shoot in Streaks
. It is important to note that although a player’s performance record does not contain more or longer streaks than chance would allow, it does not mean that the player’s performance is chance
determined
. It is not. Whether a given shot is hit or missed is determined by a host of non-chance factors, foremost among them being the skill of the offensive and defensive players involved. However, one factor that does not influence the outcome, or does not have any
predictable
influence, is the outcome of the previous shot(s). That is what our research shows.
This qualification aside, why do people believe in the hot hand when it does not exist? There are at least two possible explanations. The first involves the tendency for people’s preconceptions to bias their interpretations of what they see. Because people have theories about how confidence affects performance, they may expect to see streak shooting even before watching their first basketball game. This preconception could then influence their interpretation and memory of the game’s events. Streaks of successive hits or misses may stand out and be remembered, while sequences of frequent alternation between the two may go unnoticed and be forgotten. Or, the common occurrence of a shot popping out of the basket after having seemingly been made might be counted as a “near miss” if the player had made his last several shots, but as evidence of being extremely cold if the player had missed his last several shots.
4
(The biasing effects of people’s theories and preconceptions is discussed more thoroughly in Chapter 4.)
A second explanation involves a process that appears to be more fundamental, and thus operates even in the absence of any explicit theories people might have. Psychologists have discovered that people have faulty intuitions about what chance sequences look like.
5
People expect sequences of coin flips, for example, to alternate between heads and tails more than they actually do. Because chance produces less alternation than our intuition leads us to expect, truly random sequences look too ordered or “lumpy.” Streaks of 4, 5, or 6 heads in a row clash with our expectations about the behavior of a fair coin, although in a series of 20 tosses there is a 50-50 chance of getting 4 heads in a row, a 25 percent chance of five in a row, and a 10 percent chance of a streak of six. Because the average basketball player makes about 50% of his shots, he has a reasonably good chance of looking like he has the hot hand by making four, five, or even six shots in a row if he takes 20 shots in a game (as many players do).
To determine whether this general misconception of the laws of chance might be responsible for the belief in the hot hand, we showed basketball fans sequences of X’s and O’s that we told them represented a player’s hits and misses in a basketball game. We also asked them to indicate whether each sequence constituted an example of streak shooting. For instance, one of the sequences was OXXXOXXXOXXOOOXOOXXOO, a sequence in which the order of hits and misses is perfectly random.
*
Nevertheless, 62% of our subjects thought that it constituted streak shooting.
Note that although these judgments are wrong, it is easy to see why they were made. The sequence above does
look
like streak shooting. Six of the first eight shots were hits, as were eight of the first eleven! Thus, players and fans are not mistaken in what they see: Basketball players do shoot in streaks. But the length and frequency of such streaks do not exceed the laws of chance and thus do not warrant an explanation involving factors like confidence and relaxation that comprise the mythical concept of the hot hand. Chance works in strange ways, and the mistake made by players and fans lies in how they interpret what they see.
The Clustering Illusion
. The intuition that random events such as coin flips should alternate between heads and tails more than they do has been described by statisticians as a “clustering illusion.” Random distributions seem to us to have too many clusters or streaks of consecutive outcomes of the same type, and so we have difficulty accepting their true origins. The term illusion is well-chosen because, like a perceptual illusion, it is not eliminated by repeated examination.
6
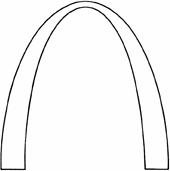
Consider the picture of St. Louis’s Gateway Arch depicted in
Figure 2.1
.
7
The arch is one of the world’s largest optical illusions: It appears to be much taller than it is wide, although its height and base are equal in length. More important, even when one is told that the height and base are equal, they still do not seem to be. The illusion cannot be overcome simply by taking another look; only an objective measurement will do. (The reader is encouraged to make the necessary measurements.)
The reaction of the professional basketball world to our research on the hot hand is instructive in this regard. Do those close to the game give up their belief in the hot hand when confronted with the relevant data? Hardly. Red Auerbach, the brains behind what is arguably the most successful franchise in American sports history, the Boston Celtics, had this to say upon hearing about our results: “Who is this guy? So he makes a study. I couldn’t care less.” Another prominent coach, Bobby Knight of the 1987 NCAA champion Indiana Hoosiers, responded by saying“… there are so many variables involved in shooting the basketball that a paper like this really doesn’t mean anything.” These comments are not terribly surprising. Because a truly random arrangement of hits and misses contains a number of streaks of various lengths, the belief in the hot hand should be held most strongly by those closest to the game. Furthermore, simply hearing that the hot hand does not exist, or merely taking another look at the game is not sufficient to disabuse oneself of this belief. It is only through the kind of objective assessment we performed that the illusion can be overcome.
Judgment by Representativeness
. In the grand scheme of things, whether or not basketball players shoot in streaks is not particularly important. What is important is the suggestion—conveyed with unusual clarity by the basketball example—that people chronically misconstrue random events, and that there may be other cases in which truly random phenomena are erroneously thought to be ordered and “real.” If so, we arrive at the more critical question of why people expect random sequences to alternate more than they do. Why, beyond noting that human nature abhors a vacuum, do people fall prey to the clustering illusion?
Figure 2.1
Gateway Arch
The best explanation to date of the misperception of random sequences is offered by psychologists Daniel Kahneman and Amos Tversky, who attribute it to people’s tendency to be overly influenced by judgments of “representativeness.”
8
Representativeness can be thought of as the reflexive tendency to assess the similarity of outcomes, instances, and categories on relatively salient and even superficial features, and then to use these assessments of similarity as a basis of judgment. People assume that “like goes with like”: Things that go together should look as though they go together. We expect instances to look like the categories of which they are members; thus, we expect someone who is a librarian to resemble the prototypical librarian. We expect effects to look like their causes; thus, we are more likely to attribute a case of heartburn to spicy rather than bland food, and we are more inclined to see jagged handwriting as a sign of a tense rather than a relaxed personality.