Simply Complexity (29 page)
Authors: Neil Johnson

(5) The study could be easily extended to look at the spread of colds within, and between, sets of schools. Hence the study had the scope to span a wide range of community sizes – from people interacting within a class, to classes interacting with each other, to year-groups in a given school interacting with each other, to schools interacting with each other within a given city, to schools in different cities and even countries interacting with each other. In addition, the study requires no special equipment – instead it is possible to apply the same methodology to any school anywhere in the world and compare the results. In fact, this is what the researchers are now working on. Their goal is to have all the data available on the Internet and updated weekly, thereby building the largest ever study of viral transmission in history.
So every Wednesday morning in the Colegio Nueva Granada each student is asked by their teacher if they have a cold. The teachers and students then help put this information in a database ready for analysis. Similar information is also passed into the database about the teachers, administrative staff, canteen staff, and even the bus drivers. With the help of Ana Maria Fernandez at the nearby Universidad de Los Andes, this database is then analyzed. Every person is assigned a unique but secret barcode to identify them, and a 0 or 1 is placed next to their name for that particular week: the 0 means “does not have a cold” while the 1 means “does have a cold”. This data then has to be cleaned up since there may have been several students absent. In particular, there is a check the following week whether the person had been away from school with a cold or not. Students who report having colds over several weeks are also checked – just to make sure that they are reporting a genuine cold and not some kind of ongoing sinusitis. Each week, the database grows by adding a further column of 1’s and 0’s with approximately 2000 entries corresponding to students, teachers and staff. Putting all the weeks of data together then leads to a mathematical picture of the evolution through time of colds in the school.
But how would you analyze such a large amount of data? The data added each week consists of approximately two thousand 1’s and 0’s – mostly 0’s since only about ten percent of the school’s population have a cold in a given week, and hence there are only ten percent of 1’s. Moreover, this then changes from week to week over the course of the school year. Like so much in science – and in particular, Complexity Science – there is no right answer or approach in terms of the analysis of this data. Basically you just have to try something sensible. The team actually tried two things. First they used the idea of networks which we looked at in
chapter 5
. In particular, they analyzed the data collected from each set of two consecutive weeks in order to work out what the network of transmission of colds might have been during that week. In other words, they drew out on a network all the possible routes that these colds might have taken from one week to the next. The way they did this was to draw a connection from anyone who had a cold in a given week, to all the people in the following week who had a cold but hadn’t had one in the previous week. In other words, a connection going from person A in week 1 to person B in week 2 means that person A had a cold in week 1 while person B did not have a cold in week 1 but did have a cold in week 2. If person B also had a cold in week 1, no connection was drawn since person A was not responsible for B’s cold in week 2. Repeating this procedure for the whole school produced a network which is shown in schematic form in
figure 10.1
.
The data from weeks 1 and 2 produces a single network as shown in
figure 10.1
. The data from weeks 2 and 3 also produces a single network; however, this will differ from the network corresponding to weeks 1 and 2. In this way, the researchers built up a set of changing networks – essentially a movie of the possible transmission lines of the common cold. They then analyzed it from the perspective of what seemed to be the most active nodes. It may not come as a surprise to long-suffering teachers everywhere, that some of the most active nodes in classrooms containing the younger kids were actually the teachers. In other words, these teachers seemed to act as super-receivers and super-givers of the common cold. They received more colds, and they gave more colds. Poor teachers! Then the research team turned to look
at the connectivity between people in the same class and between classes. In other words, they tried to deduce the effective connectivity of a typical child in terms of the other children in his or her own class, and then in terms of the children in other classes. This idea is shown in
figure 10.2
.
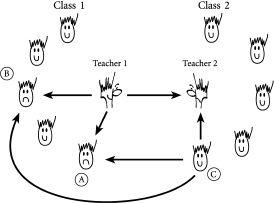
Figure 10.1
Where did that cold come from? Schematic network showing that between weeks 1 and 2, teacher 1 may have given a cold to students A and B in class 1, and to teacher 2 in class 2. Likewise student C in class 2 may have given a cold to teacher 2 in class 2, as well as to students A and B in class 1. This implies that teacher 1 and student C both had colds in week 1 while teacher 2 and students A and B did not. In week 2, neither teacher 1 nor student C had a cold, but teacher 2 and students A and B all had colds.
With the help of Chiu Fan Lee, Juan Pablo Calderon, and Jameel Kassam, the researchers managed to develop a mathematical model of what was going on. In particular, they found that they could explain the transmission of the colds in the school using a theory in which each person within a given class 1 is considered to have, on average, close contact over a given week with a number of people K
c
within his or her class, and a number of people K
b
in the remaining classes 2, 3, 4, etc. They then used a very common trick from physics, whereby these remaining classes were assumed to form part of a “sea” or “bath” of students and
teachers. In other words, everyone who was not part of class 1, became part of a bath with which class 1 interacted. Viewed from the point of view of class 1, the bath is a sort of blurred version of the rest of the school in the sense that the identity of which class is which, and which person is which, is forgotten. For a person in class 1, anyone who isn’t in class 1 is just part of this big bath. And the same is true when viewed from the perspective of class 2, except that the bath for class 2 now contains class 1 as opposed to class 2. So every class sees every other class as part of a big bath. It is well-known in physics that this type of approach can prove very successful in describing the behavior of quite complicated collections of interacting particles.
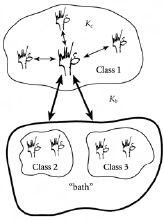
Figure 10.2
It’s who you know that counts. Each person in class 1 has, on average, close contact over a given week with a number of people K
c
within his or her class. He or she also has close contact over a given week with a number of people K
b
in the remaining classes 2, 3, 4, etc. The mathematical theory that the researchers developed was simplified greatly by assuming that these remaining classes 2, 3, 4, etc. formed an effective “bath” or “sea” in which the identity of which class is which, and which person is which, can be largely forgotten. This is a common approach in physics whereby systems of objects get replaced by a background “bath”.
Using this mathematical model, the research team were able to deduce the following information from the data. As the average
age of the class being considered increases, the number of people K
c
with which a person in that class typically has close contact, decreases. By “close contact”, the researchers mean “sufficient contact in order to transmit a virus”. This does not mean that the typical person in that class necessarily has K
c
close friends – it just means that he or she has sufficient contact with them in order to pass on the virus. This contact may be due to proximity – in short, within sneezing distance. The contact may also be indirect – such as a cold virus left on a pencil which is later used by the other person. By contrast, they also found that as the average age of the class being considered increases, the number of people K
b
in the bath with which a person in that class typically has close contact actually increases.
It is amazing that these important numbers K
c
and K
b
can be deduced from this real data involving kids, colds and classes. And the results make sense – as the kids get older, they spend less time interacting in classes (hence K
c
decreases) and more time in common activities involving all the kids in their year-group (hence K
b
increases). An additional reason why K
c
would be expected to be higher for younger children is that they tend to have closer physical contact with their peers, to be less careful to cover their mouths when they sneeze, and to be generally less conscious about personal hygiene – as any parent will again know too well.
Interestingly, this same model of transmission of viruses in communities can be applied to the conflict situations of
chapter 9
in which violence spreads like a virus between neighboring communities – and where violence in one community can spark violent acts in another. It can also be used to describe the transmission and hence spread of news or gossip in financial markets. Each community is now a particular market, or market sector, or even a particular currency as in the foreign exchange markets mentioned in
chapter 5
. Just like the colds, some rumors stay within a given community while others jump between communities if the number of contacts is large enough. This colds-based project therefore provides us with valuable insight into how objects such as a virus, news, or rumor, get transmitted through a complex network of connected groups of people. In particular, it
teaches us that it is the
differences
in the connectivity within and between communities that can play a dominant role in determining the pattern of transmission.
The implications for controlling the spreading of viruses and rumors are also interesting. Without going into too much detail, the results of the study suggest that if a super-virus is spreading through a population and is, as has been suggested, hitting children particularly hard, then the approach for control should be as follows. For younger children, attention should be focused on reducing the amount of contact within their own class – for example, by separating them more within the classroom. This will lead to a lower number of contacts
K
c
within the class – and since
K
c
is typically larger than
K
b
for younger children, this should help reduce the spread. For older age-groups the situation becomes reversed: less attention needs to be placed on the contacts
K
c
within a child’s class, and more on the contacts
K
b
between classes.
The research team are currently extending this study to other schools – and treating this extension within the mathematical model as yet another layer of communities. They are also developing the multi-community transmission model to understand the spread of news and rumors through the various currencies and stocks in a financial market, and between different global markets. In related work, Elvira Maria Restrepo at the Universidad de Los Andes is applying a similar idea to analyze the spread of crime within and between different districts of large cities.
Unfortunately, viruses and rumors aren’t the only dangerous things that spread. Cancer is something which kills by spreading. After the initial tumor has taken hold, it may spread out and become so large that it engulfs the organ to which it is attached. What’s worse is that even though such primary tumors can often be removed, cells from it may have already started spreading to other parts of the body, creating a variety of secondary tumors which are not detected until it is too late.