Statistics Essentials For Dummies (7 page)

Time Charts
A
time chart
is a data display whose main point is to examine trends over time. Another name for a time chart is a
line graph.
Typically a time chart has some unit of time on the horizontal axis (year, day, month, and so on) and a measured quantity on the vertical axis (average household income, birth rate, total sales, and so on). At each time period, the amount is shown as a dot, and the dots connect to form the time chart.
You can see from Figure 3-3 that wages for production workers, when adjusted for inflation, increased from 1947 until the early 1970s, declined during the 1970s, and basically stayed in the same range until the late 1990s, when a small surge began.
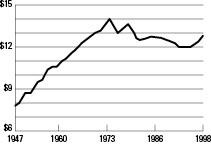
Figure 3-3:
Average hourly wage for production workers, 1947-1998 (in 1998 dollars).
A time chart can present information in a misleading way, such as charting the
number
of crimes over time, rather than the crime
rate
(crimes per capita). Because the population size of a city changes over time, crime rate is the appropriate measure. Make sure you understand what statistics are being presented and examine them for fairness and appropriateness.
Here is a checklist for evaluating time charts:
Examine the scale on the vertical (quantity) axis as well as the horizontal (timeline) axis; results can be made to look more or less dramatic than they actually are simply by changing the scale.
Histograms
A histogram is the statistician's graph of choice for numerical data. It provides a snapshot of all the data broken down into numerically ordered groups. Histograms provide a quick way to get the big idea about a numerical data set.
Making a histogram
A
histogram
is basically a bar graph that applies to numerical data. Because the data are numerical, the categories are ordered from smallest to largest (as opposed to categorical data, such as gender, which has no inherent order to it). To be sure each number falls into exactly one group, the bars on a histogram touch each other but don't overlap. Each bar is marked on the x-axis (horizontal) by the values representing its beginning and endpoints. The height of each bar of a histogram represents either the number of individuals in each group (the
frequency
of each group) or the percentage of individuals in each group (the
relative frequency
of each group).
Table 3-1 shows the number of live births in Colorado by age of mother for selected years from 1975-2000. The numerical variable age is broken down into categories of 5-year groupings. Relative frequency histograms comparing 1975 and 2000 are shown in Figure 3-4. You can see more older mothers in 2000 than in 1975.
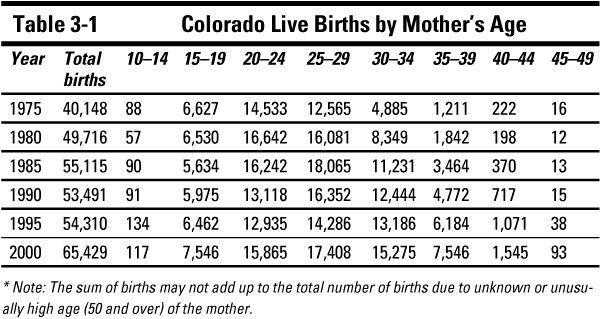
* Note: The sum of births may not add up to the total number of births due to unknown or unusually high age (50 and over) of the mother.
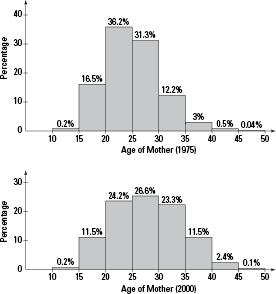
Figure 3-4:
Colorado live births, by age of mother for 1975 and 2000.
Interpreting a histogram
A histogram tells you three main features of numerical data: