Statistics Essentials For Dummies (11 page)


The final probability distribution for
X
is shown in Table 4-1. Notice they all sum to 1 because every possible value of
X
is listed and accounted for.

Finding Probabilities Using the Binomial Table
A large range of binomial probabilities are already provided in Table A-3 in the appendix (called the binomial table). In Table A-3 you see several mini-tables provided in the binomial table; each one corresponds with a different
n
for a binomial (various values of n up to 20 are available). Each mini-table has rows and columns. Running down the side of any mini-table, you see all the possible values of
X
from 0 through
n
, each with its own row. The columns of Table A-3 represent various values of
p
up through and including 0.50. (When
p
> 0.50, a slight change is needed to use Table A-3, as I explain later in this section.)
Finding probabilities when p
≤
0.50
To use Table A-3 (in the appendix) to find binomial probabilities for
X
when
p
< 0.50, follow these steps:
1. Find the mini-table associated with your particular value of
n
(the number of trials).
2. Find the column that represents your particular value of
p
(or the one closest to it).
3. Find the row that represents the number of successes (
x
) you are interested in.
4. Intersect the row and column from Steps 2 and 3 in Table A-3.
This gives you the probability for
x
successes.
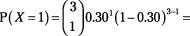
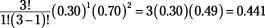
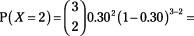
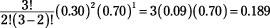
For the traffic light example, you can use Table A-3 (appendix) to verify the results found by the binomial formula shown in Table 4-1 (previous section). In Table A-3, go to the mini-table where
n
= 3, and look in the column where
p
= 0.30. You see four probabilities listed for this mini-table: 0.3430; 0.4410; 0.1890; and 0.0270; these are the probabilities for
X
= 0, 1, 2, and 3 red lights, respectively, matching those from Table 4-1.
Finding probabilities when p > 0.50
Notice that Table A-3 (appendix) shows binomial probabilities for several different values of
n
and
p
, but the values of
p
only go up through 0.50. This is because it's still possible to use Table A-3 to find probabilities when
p
is greater than 0.50. You do it by counting failures (whose probabilities are 1 -
p
) instead of successes. When
p
≥
0.50, you know (1 -
p
) < 0.50.
To use the Table A-3 to find probabilities for
X
when
p
> 0.50, follow these steps:
1. Find the mini-table associated with your particular value of
n
(the number of trials).
2. Instead of looking at the column for the probability of success (
p
), find the column that represents 1 -
p
, the probability of a failure.
3. Find the row that represents the number of failures (n-x) that are associated with the number of successes (
x
) you want.
For example, if you want the chance of 3 successes in 10 trials, it's the same as the chance of 7 failures, so look in row 7.
4. Intersect the row and column from Steps 2 and 3 in Table A-3 and you see the probability for the number of failures you counted.
This also equals the probability for the number of successes (
x
) that you wanted.
Once you've done Step 4, you're done. You do not need to take the complement of your final answer. The complements were taken care of by using the 1 -
p
and counting failures instead of successes.