Statistics Essentials For Dummies (15 page)

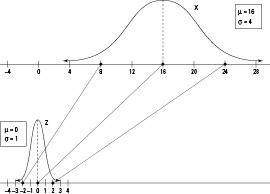
Figure 5-4:
Transforming numers on the normal distribution to numbers on the Z-distribution.
Now that you have changed
x
-values to
z
-values, you move to Step 4 and find probabilities for those
z
-values using the
Z
-table (Table A-1 in the appendix). In Problem 1 of the fish example, you want P(
Z
< -2); go to the
Z
-table and look at the row for -2.0 and the column for 0.00, intersect them, and you find 0.0228 — according to Step 5a you're done. So, the chance of a fish being less than 8 inches is equal to 0.0228.
For Problem 2, find P(
Z
> 2.00). Because it's a "greater-than" problem, this calls for Step 5b. To be able to use the
Z
-table you need to rewrite this in terms of a "less-than" statement. Because the entire probability for the
Z
-distribution equals 1, we know P(
Z
> 2.00) = 1 - P(
Z
< 2.00) = 1 - 0.9772 = 0.0228. So, the chance that a fish is greater than 24 inches is 0.0228. (Note the answers to Problems 1 and 2 are the same because the
Z
-distribution is symmetric; see Figure 5-3.)
In Problem 3, you find P(0 <
Z
< 2.00); this requires Step 5c. First find P(
Z
< 2.00), which is 0.9772 from the
Z
-table, and then subtract off the part you don't want, which is P(
Z
< 0) = 0.500 from the
Z
-table. This gives you 0.9772 - 0.500 = 0.4772. So the chance of a fish being between 16 and 24 inches is 0.4772.
Finding X for a Given Probability
Another type of problem involves finding percentiles for a normal distribution (see Chapter 2 for the rundown on percentiles.) That is, you are given the percentage or probability of being below a certain
x
-value, and you have to find the
x
-value that corresponds to it. For example, say you want the 50th percentile of the
Z
-distribution. That is, you want to find the
z
-value whose probability to its left equals 0.50. Because P(
Z
< 0) = 0.5000 (from Table A-1 of the appendix), you know that 0 is the 50th percentile for
Z
. But what about other percentiles?
Here are the steps for finding percentiles for a normal distribution
X
:
1. If you're given the probability (percent) less than
x
and you need to find
x
, you translate this as: Find
a
where P(
X
<
a
) =
p
(and
p
is given).
That is, find the
p
th percentile for X. Go to Step 3.
2. If you're given the probability (percent) greater than
x
and you need to find
x
, you translate this as: Find
b
where P(
X
>
b
) =
p
(and
p
is given).
Rewrite this as a percentile (less-than) problem: Find
b
where P(
X
<
b
) = 1 -
p
. This means find the (1 -
p
)th percentile for
X
.
3. Find the corresponding percentile for
Z
by looking in the body of the
Z
-table (Table A-1 in the appendix) and finding the probability that is closest to
p (if you came straight from Step 1) or closest to 1 - p (if you came from Step 2).
Find the row and column this number is in (using the table backwards). This is the desired
z
-value.
4. Change the
z
-value back into an
x
-value (original units) by using(This is the
Z
-formula,
, rewritten so
X
is on the left-hand side.)
You have found the desired percentile for
X
.
For the fish example, the lengths (
X
) of fish in a pond have a normal distribution with mean 16 inches and standard deviation 4 inches. Suppose you want to know what length marks the bottom 10 percent of all the fish lengths in the pond. Step 1 says translate the problem; in this case you want to find
x
such that P(
X
<
x
) = 0.10. This represents the 10th percentile for
X
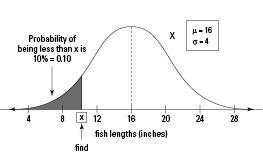
. Figure 5-5 shows a picture of what you need to find in this problem. Now to go Step 3.
Figure 5-5:
Bottom 10 percent of fish in the pond, according to length.
Step 3 says find the 10th percentile for
Z
. (Although you don't know the
x
-value that corresponds to a probability of 0.10, you are able find the value of
Z
that corresponds to 0.10, using the
Z
-table backwards.) Looking at the
Z
-table (Table A-1 in the appendix), the probability closest to 0.10 is 0.1003, which falls in the row for
z
= -1.2 and the column for 0.08. The 10th percentile for
Z
is -1.28. A fish at the bottom 10 percent is 1.28 standard deviations below the mean.
But exactly how long is the fish? In Step 4, you change the
z
-value back to an
x
-value (fish length in inches) using the
Z
-formula solved for
X
; you get
x
= 16 + -1.28
*
4 = 10.88 inches. So 10.88 inches marks the lowest 10 percent of fish lengths. Ten percent of the fish are shorter than that.
Now suppose you want to find the length that marks the top 25 percent of all the fish in the pond. This means you want to find
x
where P(X > x) = 0.25, so skip Step 1 and go to Step 2. The number you want is in the right tail (upper area) of the
X
-distribution, with
p
= 25 percent of the probability to the right and 1 -
p
= 75 percent to the left. This represents the 75th percentile for
X
.


