Statistics Essentials For Dummies (18 page)

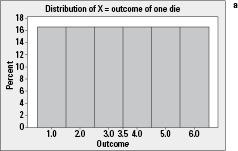
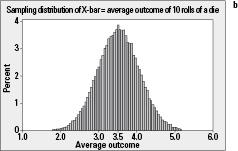
Figure 6-1:
Distributions of a) individual rolls of one die; and b) average rolls of 10 dice.
The mean of a sampling distribution
In the die rolling example, the mean of
X
(the outcome of a single die) is= 3.5, as seen in Figure 6-1a. The mean of
, denoted
, equals 3.5 as well. The average of a single roll is the same as the average of all possible sample means from 10 rolls.
In general, the mean of this population of all possible sample means is the same as the mean of the entire population. Notationally speaking, you write
. This makes sense; the average of the averages from all samples is the average of the population that the samples came from.
Using subscripts on
we can distinguish which mean we're talking about. The mean of
X
(the individuals in the population) or the mean of(all possible sample means from the population) is denoted
.
Standard error of a sampling distribution
The values in any population deviate from their mean (people have different heights, and so on). Variability in a population
of individuals (
X
) is measured in
standard deviations
(see Chapter 2). Sample means vary because you're not sampling the whole population, only a subset. Variability in the sample mean () is measured in terms of
standard errors
.
Error
here doesn't mean there's been a mistake — it means there is a gap between the population and sample results.
The standard error of the sample means is denoted by
. Its


