Statistics Essentials For Dummies (20 page)

popula-tion standard deviation,
, is in the numerator. That means as the population standard deviation increases, the standard error of the sample means increases. Mathematically this makes sense; how about statistically?
Suppose you have two ponds of fish (call them Pond #1 and Pond #2), and you want to find the average length of all the fish in each pond. Suppose you know that the fish lengths in Pond #1 have a mean of 20 inches and a standard deviation of 2 inches (see Figure 6-3a). Suppose the fish in Pond #2 also average 20 inches, but have a standard deviation of 5 inches (see Figure 6-3b). Comparing Figures 6-3a and 6-3b you see they have the same shape and mean, but the fish in Pond #2 are more variable than in Pond #1.
Now suppose you take a sample of 100 fish from Pond #1, find the mean length of the fish, and repeat this process over and over. Then do the same with Pond #2. Knowing that the fish in Pond #2 have more variability than Pond #1 in the first place, the means of the samples from Pond #2 will have more variability compared to Pond #1 as well. It's harder to estimate the population average when the population varies a lot to begin with — it's much easier to estimate the population average when the population values are similar.
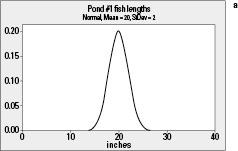
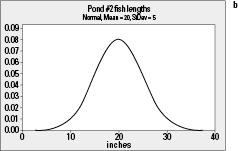
Figure 6-3:
Distributions of a) fish lengths in Pond #1; b) in Pond #2.
The shape
Now that we know the mean and standard error of
, the next step is to determine the sampling distribution of
(that is, the shape of the distribution of all possible
's from all possible samples). There are two cases: 1) the original distribution for
X
(the population) is normal; and 2) the original distribution for
X
(the population) is not normal, or is unknown.
Case 1: Distribution of X is normal
If
X
has a normal distribution, thendoes too. This is a mathematical statistics result and requires no additional tools to prove. Looking at Figure 6-2, you can see this result is true for the worker's times. Since X is normal, the shape is the same in each graph; the only thing that changes is the amount concentration around the mean.
Case 2: Distribution of X is unknown or not normal
If the
X
distribution is
any
distribution that is not normal, or if its distribution is unknown, you can't automatically say the sample means () have a normal distribution. But you can approximate
's distribution with a normal distribution — if the sample size is large enough. This result is due to the Central Limit Theorem (CLT). The CLT says that the sampling distribution (shape) of
is approximately normal, if the sample size is large enough. And the CLTdoesn't care what the distribution of
X
is!
Formally, for any population with mean
and standard deviation
, the CLT states that: