Statistics Essentials For Dummies (23 page)

The Central Limit Theorem (CLT) doesn't apply only to sample means. You can also use it with other statistics, including sample proportions. The
population proportion
,
p
, is the proportion of individuals in the population that have a certain characteristic of interest based on a binomial random variable (see Chapter 4). The
sample proportion
, denoted, is the proportion of individuals in the sample that have that same characteristic of interest. The sample proportion is the number of individuals in the sample who have that characteristic of interest divided by the total sample size (
n
). If you take a sample of 100 students and find 60 freshman, the sample proportion for freshman is 60/100 = 0.60. This section examines the sampling distribution of all possible sample proportions,, from samples of size
n
from a population.
The sampling distribution of
has these properties:
Its mean is the population proportion, denoted by
p
.
Its standard error is
. (Note that because
n
is
in the denominator, standard error decreases as
n
increases.)
Its shape is
approximately
normal, provided that the sample size is large enough. This is due to the CLT. That means you can use the normal distribution to find probabilities for. (See Chapter 5 for more.)
The larger the sample size (
n
), the closer the distribution of sample proportions is to a normal distribution.
How large is large enough for the CLT to work for categorical data? Most statisticians agree that both
np
and
n
(1 -
p
) should be greater than or equal to 10. You want the average number of successes (
np
) and the average number of failures
n(
1 -
p)
to be at least 10. (Note the second condition involves
n
(1 -
p
), not
np
(1 -
p
), the variance of the binomial distribution.)
What proportion of students need math help?
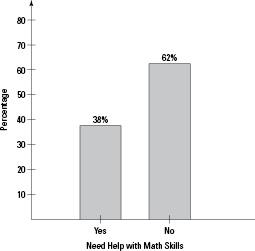
Suppose you want to know what proportion of incoming college students would like help in math. A student survey accompanies the ACT test each year, and one of the questions is whether the student would like some help with math skills. Assume (through past research) that 38% of the students taking the ACT respond yes. That means
p
= 0.38 in this case.
The original data has a binomial distribution where success = would like help. The yes responses (
p
) and no responses (1 -
p
) for the population are shown in Figure 6-4 as a bar graph. (See Chapter 3 for more on bar graphs.)

