Statistics Essentials For Dummies (25 page)

The sample size
These three factors all play important roles in influencing the width of a confidence interval. In the following sections, you see how.
Note that the sample statistic itself (for example, 50% of vehicles in the sample are semis) isn't related to the width of the confidence interval. The statistic only determines the midpoint of the confidence interval, not its width.
Choosing a Confidence Level
Variability in sample statistics is measured in standard errors. A
standard error
is very similar to the standard deviation of a data set or a population. The difference is that a standard error measures the variation among all the possible values of the statistic (for example all the possible sample means) while a standard deviation of a population measures the variation among all possible values within the population itself. (See Chapter 6 for all the information on standard errors.)
The
confidence level
of a confidence interval corresponds to the percentage of the time your result would be correct if you took numerous random samples. Typical confidence levels are 95% or 99% (many others are also used). The confidence level determines the number of standard errors you add and subtract to get the percentage confidence you want.
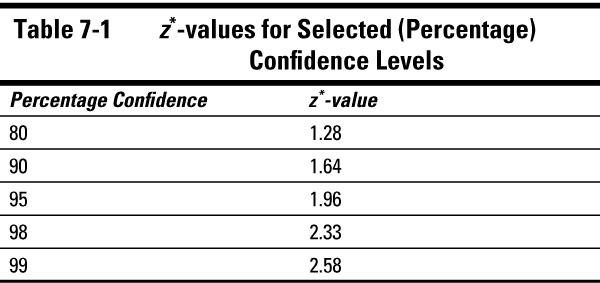
When working with means and proportions, if the proper conditions are met, the number of standard errors to be added and subtracted for a given confidence level is based on the standard normal (
Z
-) distribution, and is labeled
z*
. The higher the confidence level, the more standard errors need to be added and subtracted, hence a higher
z*
-value. For 95% confidence, the
z*
-value is 1.96, and for 99% confidence,
z*
-value is 2.58. Some of the more commonly used confidence levels, along with their corresponding
z*
-values, are given in Table 7-1.
), where
represents the percentage of confidence intervals that are incorrect (don't contain the population parameter by random chance). So if you want a 95 percent confidence interval,
= 0.05. This number
is also related to the chance of making a Type I error in a hypothesis test (see Chapter 8).
Factoring In the Sample Size
The relationship between margin of error and sample size is simple: As the sample size increases, the margin of error decreases. This confirms what you hope is true: The more information you have, the more accurate your results are going to be. (That of course, assumes that it's good, credible information — see Chapters 12 and 13.)
Looking at the formula for standard error for the sample
mean,
(from Chapter 6) notice that it has an
n
in the
denominator of a fraction; this is the case for most any standard error formula. As
n
increases, the denominator of this fraction increases, which makes the overall fraction get
smaller. That makes the margin of error,
, smaller and