Statistics Essentials For Dummies (12 page)

Revisiting the traffic light example, suppose you are now driving on side streets in your city and you still have 3 intersections (
n
= 3) but now the chance of a red light is
p
= 0.70.
Again, let
X
represent the number of red lights. Table A-3 has no column for
p
= 0.70. However, if the probability of a red light is
p
= 0.70, then the probability of a non-red light 1 - 0.70 = 0.30; so instead of counting red lights, you count non-red lights.
Let
Y
count the number of non-red lights in the three intersections;
Y
is binomial with
n
= 3 and
p
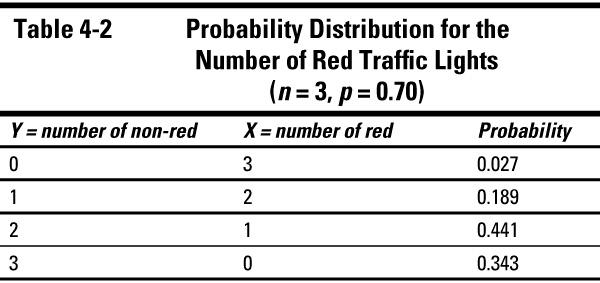
= 0.30. The probability distribution for
Y
is shown in Table 4-2. This is also the probability distribution for
X
, the number of red lights (
n
= 3 and
p
= 0.70), which is what you originally asked for.
Finding probabilities for X greater-than, less-than, or between two values
Table A-3 (appendix) shows probabilities for
X
being equal to any value from 0 to
n
, for a variety of
p
s. To find probabilities for
X
being less-than, greater-than, or between two values, just find the corresponding values in the table and add their probabilities. For the traffic light example where
n
= 3 and
p
= 0.70, if you want
P
(
X
> 1), you find
P
(
X
= 2) +
P
(
X
= 3) and get 0.441 + 0.343 = 0.784. The probability that
X
is between 1 and 3 (inclusive) is 0.189 + 0.441 + 0.343 = 0.973.
Two phrases to remember: "at-least" means that number or higher; "at-most" means that number or lower. For example the probability that
X
is at least 2 is
P
(
X
≥
2); the probability that
X
is at most 2 is
P
(
X
≤
2).
The Expected Value and Variance of the Binomial
The mean of a random variable is the long-term average of its possible values over the entire population of individuals (or trials). It's found by taking the weighted average of the
x-
values multiplied by their probabilities. The mean of a random variable is denoted by. For the binomial random variable the mean is
.
Suppose you flip a fair coin 100 times and let
X
be the number of heads; this is a binomial random variable with
n
= 100 and
p
= 0.50. Its mean is
np
= 100(0.50) = 50.
The variance of a random variable
X
is the weighted average of the squared deviations (distances) from the mean. The variance of a random variable is denoted by. The variance of the binomial distribution is
. The standard deviation of
X
is just the square root of the variance, which in this case is.
Suppose you flip a fair coin 100 times and let
X
be the number of heads. The variance of
X
is
np
(1 -
p
) = 100(0.50)(1 - 0.50) = 25, and the standard deviation is the square root, which is 5.
p
is the probability of a success, but it also represents the
proportion
of successes you can expect in
n
trials. Therefore the total
number
of successes you can expect — that is, the mean of
X
— equals
np
. The only variability in the outcomes of each trial is between success (with probability
p
) and failure (with probability 1 -
p
). Over
n
trials, it makes sense that the variance of the number of successes/failures is measured by
np
(1 -
p)
.