Teaching the Common Core Math Standards With Hands-On Activities, Grades 3-5 (83 page)
Read Teaching the Common Core Math Standards With Hands-On Activities, Grades 3-5 Online
Authors: Judith A. Muschla,Gary Robert Muschla,Erin Muschla-Berry
Tags: #Education, #Teaching Methods & Materials, #Mathematics, #General

BOOK: Teaching the Common Core Math Standards With Hands-On Activities, Grades 3-5
5.09Mb size Format: txt, pdf, ePub
Name _________________________________ Date ________________
Measurement Word Problems
Directions: Solve each problem.
1.
Jason watched his father build a foundation for a new house. Jason's father told him that the foundation would have 6 layers of cinder blocks. Each cinder block was 8 inches high. How many feet high would the foundation be?
2.
Danielle had a lot of homework last night. She did 20 minutes of math, 10 minutes of spelling, 25 minutes of science, and 25 minutes of social studies. She told her brother that she worked on her homework forhours. Was she correct? If not, what was the difference in minutes of how long she really worked compared to what she told her brother?
3.
Lila was wrapping two birthday presents for her brother. She estimated that she would need 70 centimeters of ribbon for one package and 80 centimeters of ribbon for the other package. She had 1.8 meters of ribbon. Did she have enough ribbon to wrap the package? If not, how much ribbon did she still need?
4.
Mrs. Harper volunteered to bring juice for her daughter's class for the fifth grade picnic. She needed enough juice for 60 eight-ounce cups. She bought 4 gallons of juice. Would this be enough juice? If not, how much more juice did she need to buy?
5.
Jacob and his father enjoy hiking. To prepare for their next hike, Jacob's father asked him to pack water. Jacob was to pack 2 liters of water for himself and 2 liters for his father. But when Jacob started to pack water bottles, he saw that each bottle contained 500 milliliters. How many bottles should Jacob pack in all for his father and himself?
Measurement and Data: 5.MD.2
“Represent and interpret data.”
2. “Make a line plot to display a data set of measurements in fractions of a unit. Use operations on fractions for this grade to solve problems involving information presented in line plots.”
Background
A line plot, also known as a dot plot, displays data along a number line. Each value of the data is marked with a symbol noting the frequency.
For example, a line plot displaying the lengths is shown below.
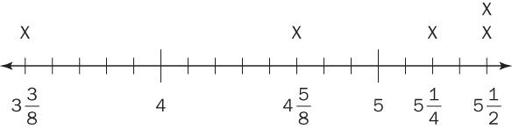
Note that an X is placed above the value each time the value appears.
Activity: Line Plots and Plant Height
Students will create line plots that show the heights of bean plants. They will then answer questions based on their line plots. (
Note:
Although the data for this activity is provided, you may prefer to actually have your students grow bean plants and measure their growth. Suggestions for growing the plants are provided at the end of the activity.)
Materials (if students are using provided data)
Ruler with a-inch scale; reproducible, “Bean Plant Growth,” for each student.
Procedure
1.
Explain to your students that a line plot is a graph that shows the frequency of data along a number line. It is also called a dot plot. Present the example of the line plot provided in the Background. Because the largest denominator of the data is 8, the intervals between whole numbers are divided into eighths. The number line does not start at 0, but at, which is the smallest value in this set of data. It ends with
, which is the largest value. The frequency of the data is marked by an X above each value.
2.
Explain that students will be creating a line plot that shows the height of bean plants three weeks after they were planted. You might note that the same kind of plants may grow at different rates due to a variety of factors, such as the amount of sunlight, temperature, amount of water, and type of soil.
3.
Distribute copies of the reproducible. Explain that it contains data that shows the height of 30 bean plants that were planted three weeks ago. (
Note:
The heights are given as whole numbers, in eighths, in fourths, or in halves.) In some cases, students will have to recognize equivalent fractions, for example,. Near the bottom of the sheet is a line students are to use to draw their line plot.
4.
Offer suggestions to help your students construct their line plots.
- Find the smallest and largest values of the data.
- Make a small vertical line on the line at the bottom of the reproducible to represent the smallest value. Place this vertical line at the beginning or near the beginning of the line. Place an X above this value above the number line.
- Using a ruler and starting with the smallest value, mark off units at
 -inch intervals. Stop at the number that represents the largest value, or stop a little beyond this number. Place an X above this value above the number line.
 - Label points on the number line for reference. Place an X every time a value is recorded. For example, if a value appears twice, two X's are required.
Other books
Winsor, Linda by Along Came Jones
Road to Victory (Dogs of Fire Book 5) by Piper Davenport
Love and Tattoos by Matthews, Lissa
The Moldy Dead by Sara King
The Jewels of Warwick by Diana Rubino
Wanting It All: A Naked Men Novel by Christi Barth
The Secret of the Nagas by Amish Tripathi
A French Wedding by Hannah Tunnicliffe
Hold Me Down Hard by Cathryn Fox