Read The Bell Curve: Intelligence and Class Structure in American Life Online
Authors: Richard J. Herrnstein,Charles A. Murray
Tags: #History, #Science, #General, #Psychology, #Sociology, #Genetics & Genomics, #Life Sciences, #Social Science, #Educational Psychology, #Intelligence Levels - United States, #Nature and Nurture, #United States, #Education, #Political Science, #Intelligence Levels - Social Aspects - United States, #Intellect, #Intelligence Levels
The Bell Curve: Intelligence and Class Structure in American Life (23 page)

We do not have the choice of leaving the issue of causation at that, however. Because intelligence has been such a taboo explanation for social behavior, we assume that our conclusions will often be resisted, if not condemned. We can already hear critics saying, “If only they had added this other variable to the analysis, they would have seen that intelligence has nothing to do with X.” A major part of our analysis accordingly has been to anticipate what other variables might be invoked and seeing if they do in fact attenuate the relationship of IQ to any given social behavior. This was not a scattershot effort. For each relationship, we asked ourselves if evidence, theory, or common sense suggests another major causal story. Sometimes it did. When looking at whether a new mother went on welfare, for example, it clearly was not enough to know the general socioeconomic background of the woman’s parents. It was also essential to examine her own economic situation at the time she had the baby: Whatever her IQ is, would she go on welfare if she had economic resources to draw on?
At this point, however, statistical analysis can become a bottomless pit. It is not uncommon in technical journals to read articles built around the estimated effects of a dozen or more independent variables. Sometimes the entire set of variables is loaded into a single regression equation. Sometimes sets of equations are used—modeling even more
complex relationships, in which all the variables can exert mutual effects on one another.
Why should we not press forward? Why not also ask if religious background has an effect on the decision to go on welfare, for example? It is an interesting question, as are another fifty others that might come to mind. Our principle was to explore additional dynamics when there was another factor that was not only conceivably important but for clear logical reasons might be important
because of dynamics having little or nothing to do with IQ.
This last proviso is crucial, for one of the most common misuses of regression analysis is to introduce an additional variable that in reality is mostly another expression of variables that are already in the equation.
Education posed a special and continuing problem. On the one hand, education can be important independent of cognitive ability. For example, education tends to delay marriage and childbirth because the time and commitment involved in being in school competes with the time and commitment it takes to be married or have a baby. Education shapes tastes and values in ways that are independent of the cognitive ability of the student. At the same time, however, the role of education versus IQ as calculated by a regression equation is tricky to interpret, for four reasons.
First, the number of years of education that a youth gets is
caused
to an important degree by both the parents’ SES and the youth’s own academic ability. In the NLSY, for example, the correlation of years of education with parental SES and youth’s IQ are +.50 and +.64, respectively. This means that when years of education is used as an independent variable, it is to some extent expressing the effects of SES and IQ in another form.
Second, any role that education plays independent of intelligence is likely to be discontinuous. For example, it may make a big difference to many outcomes that a person has a college degree. But how is one to interpret the substantive difference between one year of college and two? Between one year of graduate school and two? They are unlikely to be nearly as important as the difference between “a college degree” and “no college degree.”
Third, variables that are closely related can in some circumstances produce a technical problem known as
multicollinearity,
whereby the solutions
produced by regression equations are unstable and often misleading.
Fourth and finally, to take education’s regression coefficient seriously tacitly assumes that intelligence and education could vary independently and produce similar results. No one can believe this to be true in general: indisputably, giving nineteen years of education to a person with an IQ of 75 is not going to have the same impact on life as it would for a person with an IQ of 125. The effects of education, whatever they may be, depend on the coexistence of suitable cognitive ability in ways that often require complex and extensive modeling of interaction effects—once again, problems that we hope others will take up but would push us far beyond the purposes of this book.
Our solution to this situation is to report the role of cognitive ability for two subpopulations of the NLSY that each have the same level of education: a high school diploma, no more and no less in one group; a bachelor’s degree, no more and no less, in the other. This is a simple, but we believe reasonable, way of bounding the degree to which cognitive ability makes a difference independent of education.
We walk through all three of these basics—the NLSY, the five cognitive classes, and the format for the statistical analysis—in a step-by-step fashion in the next chapter, where we use poverty to set the stage for the social behaviors to follow. Chapter 6 returns to education, this time not just talking about how far people got but the comparative roles of IQ and SES in determining how far someone gets in school. Then, seriatim, we take up unemployment and labor force dropout (Chapter 7), single-parent families and illegitimacy (Chapter 8), welfare dependency (Chapter 9), parenting (Chapter 10), crime (Chapter 11), and civic behavior (Chapter 12).
In these eight chapters, we limit the analysis to whites, and more specifically to non-Latino whites.
11
This is, we think, the best way to make yet another central point: Cognitive ability affects social behavior without regard to race or ethnicity. The influence of race and ethnicity is deferred to Part III.
Poverty
Who becomes poor? One familiar answer is that people who are unlucky enough to be born to poor parents become poor. There is some truth to this. Whites, the focus of our analyses in the chapters of Part II, who grew up in the worst 5 percent of socioeconomic circumstances are eight times more likely to fall below the poverty line than those growing up in the top 5 percent of socioeconomic circumstances. But low intelligence is a stronger precursor of poverty than low socioeconomic background. Whites with IQs in the bottom 5 percent of the distribution of cognitive ability are fifteen times more likely to be poor than those with IQs in the top 5 percent.
How does each of these causes of poverty look when the other is held constant? Or to put it another way: If you have to choose, is it better to be born smart or rich? The answer is unequivocally “smart.” A white youth reared in a home in which the parent or parents were chronically unemployed, worked at only the most menial of jobs, and had not gotten past ninth grade, but of just average intelligence—an IQ of 100—has nearly a 90 percent chance of being out of poverty by his or her early 30s. Conversely, a white youth born to a solid middle-class family but with an IQ equivalently below average faces a much higher risk of poverty, despite his more fortunate background.
When the picture is complicated by adding the effects of sex, marital status, and years of education, intelligence remains more important than any of them, with marital status running a close second. Among people who are both smart and well educated, the risk of poverty approaches zero. But it should also be noted that young white adults who marry are seldom in poverty, even if they are below average in intelligence or education. Even in these more complicated analyses, low IQ continues to be a much stronger precursor of poverty than the socioeconomic circumstances in which people grow up.
W
e begin with poverty because it has been so much at the center of concern about social problems. We will be asking, “What
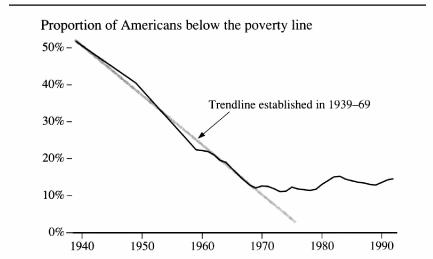
causes poverty?” focusing on the role that cognitive ability might play. Our point of departure is a quick look at the history of poverty in the next figure, which scholars from the Institute for Research on Poverty have now enabled us to take back to the 1930s.
1
Dramatic progress against poverty from World War II through the 1960s, stagnation since then
Sources:
SAUS, various editions; Ross and others, 1987.
In 1939, over half of the people of the United States lived in families with an income below the amount that constitutes the present poverty line—in constant dollars, of course. This figure declined steeply through World War II, and then through the Truman, Eisenhower, Kennedy, and Johnson administrations. Then came a sudden and lasting halt to progress. As of 1992, 14.5 percent of Americans were below the poverty line, within a few percentage points of the level in 1969. This history provokes three observations.
The first is that poverty
cannot
be a simple, direct cause of such problems as crime, illegitimacy, and drug abuse. Probably no single observation about poverty is at once so indisputable and so ignored. It is indisputable because poverty was endemic at a time when those problems were minor. We know that reducing poverty cannot, by itself, be expected to produce less criminality, illegitimacy, drug abuse, or the rest
of the catalog of social problems, else the history of the twentieth century would have chronicled their steep decline.
The second point illustrated by the graph of poverty is that the pool of poor people must have changed over time. As late as the 1940s, so many people were poor in economic terms that to be poor did not necessarily mean to be distinguishable from the rest of the population in any other way. To rephrase the dialogue between F. Scott Fitzgerald and Ernest Hemingway, the poor were different from you and me: They had less money. But that was almost the only reliable difference. As affluence spread, people who escaped from poverty were not a random sample of the population. When a group shrinks from over 50 percent of the population to the less than 15 percent that has prevailed since the late 1960s, the people who are left behind are likely to be disproportionately those who suffer not only bad luck but also a lack of energy, thrift, farsightedness, determination—and brains.
The third point of the graph is that some perspective is in order about what happened to poverty during the 1960s and the famous War on Poverty. The trendline we show for 1936-1969 would have had about the same slope if we had chosen any of the decades in between to calculate it. The United States was not only getting richer but had been reducing the percentage of people below the modern poverty line for at least three decades before the 1960s came to a close. We will not reopen here the continuing debate about why progress came to an end when it did.
In this chapter, we explore some basic findings about the different roles that intelligence and social background play in keeping individuals out of poverty. The basics may be stated in a few paragraphs, as we did in the chapter’s introduction. But we also want to speak to readers who ask, “Yes, but what about the role of…,” thinking of the many other potential causes of white poverty. By the end of the chapter, we will have drawn a controversial conclusion. How did we get there? What makes us think that we have got our causal ordering right? We will walk through the analyses that lie behind our conclusions, taking a more leisurely approach than in the chapters to come.
We need to deal at once with an issue that applies to most of the topics in Part II. We want to consider poverty as an effect rather than as a
cause—in social science terminology, as a dependent, not an independent, variable.
2
Intelligence will be evaluated as a factor that bears on becoming poor. But what, after all, does an intelligence test score mean for an adolescent who has grown up poor? Wouldn’t his test score have been higher if his luck in home environment had been better? Can IQ be causing poverty if poverty is causing IQ?
The Stability of IQ over the Life Span
The stability of IQ over time in the general population has been studied for decades, and the main findings are not in much dispute among psychometricians. Up to about 4 or 5 years of age, measures of IQ are not of much use in predicting later IQ. Indeed, you will get a better prediction of the child’s IQ at age 15 by knowing his parents’ IQ than by any test of the child given before age 5.
3
Between ages 5 and 10, the tests rapidly become more predictive of adult IQ.
4
After about the age of 10, the IQ score is essentially stable within the constraints of measurement error.
5
On the comparatively rare occasions when large changes in IQ are observed, there is usually an obvious explanation. The child had been bedridden with a long illness before one of the tests, for example, or there was severe emotional disturbance at the time of one or both of the tests.
