Read The Bell Curve: Intelligence and Class Structure in American Life Online
Authors: Richard J. Herrnstein,Charles A. Murray
Tags: #History, #Science, #General, #Psychology, #Sociology, #Genetics & Genomics, #Life Sciences, #Social Science, #Educational Psychology, #Intelligence Levels - United States, #Nature and Nurture, #United States, #Education, #Political Science, #Intelligence Levels - Social Aspects - United States, #Intellect, #Intelligence Levels
The Bell Curve: Intelligence and Class Structure in American Life (24 page)

The IQ score of an individual might have been higher if he had been raised in more fortunate circumstances. Chapter 17 discusses this issue in more detail. But for purposes of Part II, the question is not what might have been but what is. In discussions of intelligence, people obsess about nature versus nurture, thinking that it matters fundamentally whether a person with a low IQ at, say, age 15 came by that IQ through a deficient environment or by bad luck in the genetic draw. But it does not matter for the kinds of issues we consider in Part II. The AFQT test scores for the NLSY sample were obtained when the subjects were 15 to 23 years of age, and their IQ scores were already as deeply rooted a fact about them as their height.
6
For a century after poverty became a topic of systematic analysis in the mid-1800s, it was taken for granted that there were different kinds of
poor people, with “deserving” and “undeserving” being one of the primary divisions.
7
Some people were poor because of circumstances beyond their control; others were poor as a result of their own behavior. Such distinctions among types of poverty were still intellectually respectable into the beginning of the Kennedy administration in 1961. By the end of the 1960s, they were not. Poverty was now seen as a product of broad systemic causes, not of individual characteristics. To say otherwise was to “blame the victim.”
8
Accordingly, the technical literature about the causes of current poverty deals almost exclusively in economic and social explanations rather than with individual characteristics. Much of this literature focuses on poverty among blacks and its roots in racism and does not apply to the topic at hand: poverty among whites.
It seems easy to make the case that poverty among whites also arises from social and economic causes. Using the NLSY, we convert information about the education, occupations, and income of the parents of the NLSY youths into an index of socioeconomic status (SES) in which the highest scores indicate advanced education, affluence, and prestigious occupations. The lowest scores indicate poverty, meager education, and the most menial jobs. Suppose we then take the SES index and divide all the NLSY youngsters into five socioeconomic classes on exactly the same basis that we defined cognitive classes (split into categories of 5-20-50-20-5 percent of the population). We then ask, What percentage of people who came from those socioeconomic backgrounds were below the poverty line in their late 20s and early 30s (i.e., in 1989)? We exclude those who were still in school. The answer for non-Latino whites in the NLSY sample is shown in the following table. What could be plainer? Hardly any of the lucky 5 percent who had grown up in the most advantaged circumstances were in poverty (only 3 percent). Meanwhile, the white children of parents in the lowest socioeconomic class had a poverty rate of 24 percent. Rank hath its privileges, and in the United States one of those privileges is to confer economic benefits on your children. The way to avoid poverty in the United States is to be born into an advantaged home.
| White Poverty by Parents’ Socioeconomic Class | |
|---|---|
| Parents’ Socioeconomic Class | Percentage in Poverty |
| Very high | 3 |
| High | 3 |
| Mid | 7 |
| Low | 12 |
| Very low | 24 |
| Overall average | 7 |
Now we switch lenses. Instead of using socioeconomic class, we now ask, What percentage of the people who are in the different
cognitive
classes were below the poverty line in 1989? The answer is in the next table. There are similarities at the top of the ladder. Those in the top three classes—75 percent of the population—in either socioeconomic background or intelligence had similar poverty rates. But then the story diverges. As cognitive ability fell below average, poverty rose even more steeply among the cognitively disadvantaged than the socioeconomically disadvantaged. For the very dull, in the bottom 5 percent in IQ, 30 percent were below the poverty line, fifteen times the rate for the people in the top cognitive class.
| White Poverty by Cognitive Class | |
|---|---|
| Cognitive Class | Percentage in Poverty |
| I Very bright | 2 |
| II Bright | 3 |
| III Normal | 6 |
| IV Dull | 16 |
| V Very dull | 30 |
| Overall average | 7 |
Taken one variable at a time, the data fit both hypotheses: Poverty is associated with socioeconomic disadvantage and even more strongly with cognitive disadvantage. Which is really explaining the relationship? And so we introduce a way of assessing the comparative roles of intelligence and socioeconomic background, which we will be using several times in the course of the subsequent chapters.
We want to disentangle the comparative roles of cognitive ability and socioeconomic background in explaining poverty. The dependent variable, poverty, has just two possible values: Yes, the family had an income below the poverty line in 1989, or no, its income was above the poverty
line. The statistical method is a type of regression analysis specifically designed to estimate relationships for a yes-no kind of dependent variable.
9
In our first look at this question, we see how much poverty depends on three independent variables: IQ, age, and parental socioeconomic status (hereafter called “parental SES”). The sample consists of all whites in the NLSY who were out of school in 1989.
10
We are asking a straightforward question:
Given information about intelligence, socioeconomic status, and age, what is our best estimate of the probability that a family was below the poverty line in 1989?
for which a computer, using the suitable software, can provide an answer. Then we ask a second question:
Taking the other factors into account,
how much remaining effect does any one of the independent variables have on the probability of being in poverty?
for which the computer can also provide an answer.
When we apply these questions to the NLSY data, the figure below shows what emerges. First, age in itself is not important in determining whether someone is in poverty once the other factors of intelligence and parental family background are taken into account.
11
Statistically, its impact is negligible.
This leaves us with the two competing explanations that prompted the analysis in the first place: the socioeconomic background in which the NLSY youth grew up, and his own IQ score.
The black line lets you ask, “Imagine a person in the NLSY who comes from a family of exactly average socioeconomic background and exactly average age.
12
What are this person’s chances of being in poverty if he is very smart? Very dumb?” To find out his chances if he is smart, look toward the far right-hand part of the graph. A person with an IQ 2 SDs above the mean has an IQ of 130, which is higher than 98 percent of the population. Reading across to the vertical axis on the left, that person has less than a 2 percent chance of being in poverty (always assuming that his socioeconomic background was average). Now think about someone who is far below average in cognitive ability, with an IQ 2 SDs below the mean (an IQ of 70, higher than just 2 percent of the
population). Look at the far left-hand part of the graph. Now, our imaginary person with an average socioeconomic background has about a 26 percent chance of being in poverty. The gray line lets you ask, “Imagine a person in the NLSY who is exactly average in IQ and age. What are this person’s chances of being in poverty if he came from an extremely advantaged socioeconomic background? An extremely deprived socioeconomic background?” As the gray line indicates, the probability of being in poverty rises if he was raised by parents who were low in socioeconomic status, but only gradually.
The comparative roles of IQ and parental SES in determining whether young white adults are below the poverty line
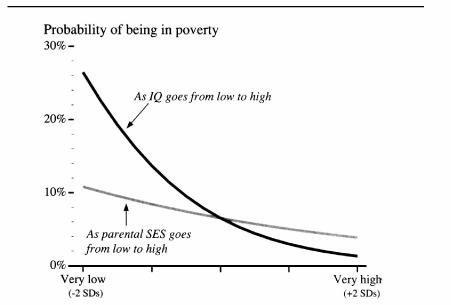
Note: For computing the plot, age and either SES (for the black curve) or IQ (for the gray curve) were set at their mean values.
Refresher
½ standard deviation below and above the mean cuts off the 31st and 69th percentiles. A ½ SD difference is substantial.
1 standard deviation below and above the mean cuts off the 16th and 84th percentiles. A 1 SD difference is big.
2 standard deviations below and above the mean cuts off the 2d and 98th percentiles. A 2 SD difference is very big.
A “standard score” means one that is expressed in terms of standard deviations.
In general, the visual appearance of the graph lets you see quickly the result that emerges from a close analysis: Cognitive ability is more important than parental SES in determining poverty.
13
This does not mean that socioeconomic background is irrelevant. The magnitude of the effect shown in the graph and its statistical regularity makes socioeconomic status significant in a statistical sense. To put it into policy terms, the starting line remains unequal in American society, even among whites. On the other hand, the magnitude of the disadvantage is not as large as one might expect. For example, imagine a white person born in 1961 who came from an unusually deprived socioeconomic background: parents who worked at the most menial of jobs, often unemployed, neither of whom had a high school education (a description of what it means to have a socioeconomic status index score in the 2d centile on socioeconomic class).
If that person has an IQ of 100—
nothing special, just the national average—the chance of falling below a poverty-level income in 1989 was 11 percent. It is not zero, and it is not as small as the risk of poverty for someone from a less punishing environment, but in many ways this is an astonishing statement of progress. Conversely, suppose that the person comes from the 2d centile in IQ but his parents were average in socioeconomic status—which means that his parents worked at skilled jobs, had at least finished high school, and had an average income. Despite coming from that solid background, his odds of being in poverty are 26 percent, more than twice as great as the odds facing the person from a deprived home but with average intelligence.
In sum: Low intelligence means a comparatively high risk of poverty. If a white child of the next generation could be given a choice between being disadvantaged in socioeconomic status or disadvantaged in intelligence, there is no question about the right choice.
Now let us consider whether education really explains what is going on. One familiar hypothesis is that if you can only get people to stick with school long enough, they will be able to stay out of poverty even if they have modest test scores.
As in subsequent chapters, we will consider two educational groups:
white people with a high school degree (no more, no less) and those with a bachelor’s degree (no more, no less). The figure above shows the results when the poverty rates for these two groups are considered separately.
In the white high school sample, high IQ makes a difference in avoiding poverty; in the college sample, hardly anyone was poor
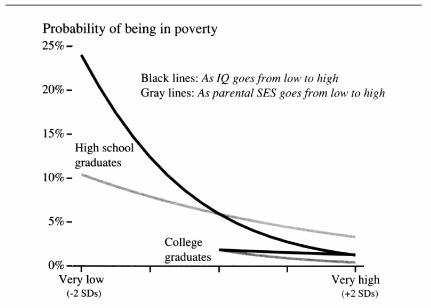
Note: For computing the plot, age and either SES (for the black curve) or IQ (for the gray curve) were set at their mean values.
First, look at the pair of lines for the college graduates. We show them only for values greater than the mean, to avoid nonsensical implications (such as showing predicted poverty rate for a college graduate with an IQ two standard deviations below the mean). The basic lesson of the graph is that people who can complete a bachelor’s degree seldom end up poor, no matter what. This makes sense. Although income varies importantly for college graduates at different cognitive levels (as we discussed in Chapters 2 through 4), the floor income is likely to be well above the poverty line. College has economic value independent of cognitive ability, whether as a credential, for the skills that are acquired, or as an indicator of personal qualities besides IQ (diligence, persistence) that make for economic success in life. It is impossible with these data to disentangle what contributions these different explanations make.
