Read The Bell Curve: Intelligence and Class Structure in American Life Online
Authors: Richard J. Herrnstein,Charles A. Murray
Tags: #History, #Science, #General, #Psychology, #Sociology, #Genetics & Genomics, #Life Sciences, #Social Science, #Educational Psychology, #Intelligence Levels - United States, #Nature and Nurture, #United States, #Education, #Political Science, #Intelligence Levels - Social Aspects - United States, #Intellect, #Intelligence Levels
The Bell Curve: Intelligence and Class Structure in American Life (39 page)

Each of the developmental indexes we have reviewed is based on a number of individual items, which in turn lend themselves to a wide variety of analyses that would take us far beyond the scope of this discussion.
We conducted many analyses for the separate indexes, but the overall patterns were similar. For our purposes in conveying to you the general pattern of results, it is sufficient to summarize the results for a broad question: What independent role, if any, does the mother’s IQ have on the probability that her child experiences a substantial developmental problem? We created a simple “developmental problem index,” in which the child scores “Yes” if he or she were in the bottom decile of any of the four indicators in a given test year, and “No” if not. The results are shown in the next figure.
Both a white mother’s IQ and socioeconomic background have moderate relationships with developmental problems in the child
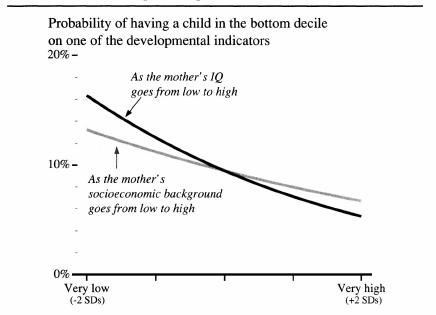
The pattern shown in the figure generally applies to the four development indicators separately: IQ has a somewhat larger independent effect than socioeconomic background, but of modest size and marginal statistical significance.
We repeated the analyses adding a poverty variable (Was the mother living in poverty in the year the developmental measures were taken?), a welfare variable (Was the mother on AFDC in the year the developmental measures were taken?), and legitimacy variable (Was the child born outside marriage?) When entered separately or in combination, each had a statistically significant independent role.
69
Consider the stark contrast between a child born to an unmarried mother, on welfare and in poverty, and a child born to a married mother, not on welfare and above the poverty line. Given a mother with average IQ and socioeconomic background, the chances that the first child had a substantial developmental problem were almost twice as high as those facing the second child—15 percent compared to 8 percent. But taking these factors into account did not wipe out the independent role of either IQ or the mother’s socioeconomic background; in fact, the independent effects of IQ and socioeconomic background after extracting the independent role of poverty, illegitimacy, and welfare, are visually almost indistinguishable from the one shown above.
Analyses of the college graduate sample were provocative but no more than that, because only 29 out of 470 children of white college graduates who were tested (6 percent) showed up with a substantial developmental problem. The provocative finding was that among those 29, 5 were children of women in Class 1(10 percent of the 50 such children tested). Thus in the college sample, the statistical result of holding socioeconomic background constant was that higher IQ was associated with a substantially higher probability of having developmental problems. Five out of 50 is of course not enough to make much of these numbers, but we commend the finding to our colleagues who specialize in child development.
Within the high school sample, the independent roles of IQ and socioeconomic background were almost identical, and of the same order of magnitude indicated in the figure for the entire white sample.
We finally come to the intelligence of the children of white NLSY women. The measure of intelligence we shall be using is the Peabody Picture Vocabulary Test (PPVT), a widely used measure of cognitive ability in children that has the advantage of not requiring that the child be able to read. The scores for the NLSY children are expressed in terms of the national norms for the PPVT, which use a mean of 100 and a standard deviation of 15. Because IQ scores tend to be volatile for children under the age of 6, we limit the sample to children who were at least 6 when they took the test.
The unsurprising news in the next table is that the children tend to resemble their mothers in IQ.
70
But by continuing to use the “worst decile” as a way of zeroing in on the children most at risk, the table makes another point: White parents throughout the top three-quarters of the IQ distribution have few children who fall into the bottom decile of IQ.
71
For mothers in the bottom quarter of the distribution, however, the proportion of low IQ children rises precipitously. We return to this issue in Chapter 15.
| IQ in the Mother and the Child for Whites in the NLSY | ||
|---|---|---|
| Cognitive Class of the Mothers | Mean IQ of Their Children | Percentage of Their Children in the Bottom Decile of IQ |
| I Very bright | — | — |
| II Bright | 107 | 7 |
| III Normal | 100 | 6 |
| IV Dull | 95 | 17 |
| V Very dull | 81 | 39 |
| All whites | 99 | 10 |
Consistent with the conclusions drawn in a large technical literature, the IQ of the NLSY mothers was much more important than their socioeconomic background in determining their children’s IQ.
72
A white child’s IQ in the NLSY sample went up by 6.3 IQ points for each increase of one standard deviation in the mother’s IQ, compared to L 7 points for each increase of one standard deviation in the mother’s socioeconomic
background (in an analysis that also extracted the effects of the mother’s age, the test year, and the age of the child when tested). When we examine the probability that the child will fall in the bottom decile of IQ, we arrived at the results shown in the next figure.
A white mother’s IQ dominates the importance of socioeconomic background in determining the child’s IQ
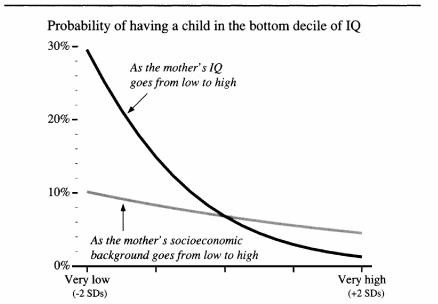
Note: For computing the plot, age and either SES (for the black curve) or IQ (for the gray curve) were set at their mean values. Additional independent variables were used to control for the test year and the age of the children when they took the test.
A mother at the 2d IQ centile but of average socioeconomic background had a 30 percent chance that her child would be in the bottom decile of IQ, compared to only a 10 percent chance facing the woman from an equivalently terrible socioeconomic background (2d centile on the SES index) but with an average IQ.
In discussions of IQ among disadvantaged groups, it seems plausible that factors such as poverty and the aspects of the home environment would have an effect on the child’s IQ. Suppose, for example, we were to ignore the mother’s IQ, and look only at her socioeconomic background,
her poverty status in the year before her child was tested, and her HOME index score. In that case, we could document the conventional wisdom: both socioeconomic background and the home environment have large effects on whether a child scores in the bottom IQ decile. Poverty has a smaller and statistically marginal effect. But when we add the mother’s IQ, all of those other effects become both small in magnitude and statistically insignificant. After taking socioeconomic background, the HOME index, and pretest poverty into account, the independent effect of IQ remains virtually identical to the one shown on the preceding figure.
None of the children in the bottom decile of IQ had a mother with a bachelor’s degree. In the high school graduate sample, the independent role of the mother’s IQ remains large and the independent role of socioeconomic background remains small. But in the process of exploring this issue, we came upon an effect of education that is worth exploring: Women who did not complete high school were at much higher risk of producing children in the bottom decile of IQ than women in the high school sample (meaning a high school diploma and exactly 12 years of education), even after controlling for mother’s IQ and socioeconomic background. Additional analyses did not clarify what this finding might mean; we commend it to our colleagues for a full-scale analysis.
Granting the many exceptions at the individual level, the relationship of cognitive ability to parenting is unmistakable. Some of these analyses have involved measures that are arguable. Can we really be sure that the indicators of what constitutes a stimulating and nurturing environment are not just reflections of the preferences of the upper middle class? We hope our readers do not take this easy way out. If the indicators that were used in the studies we have reported are indeed ones that you find valid in your own beliefs about what children need, then the conclusion follows: Over the long run and in the broad perspective, based on your best understanding of the realities of child rearing, smart parents tend to be better parents. People with low cognitive ability tend to be worse parents. This conclusion holds for a wide range of parenting behaviors,
from prenatal negligence that leads to low birth weight, to postnatal treatment of the child associated with neglect and abuse, to developmental outcomes, to cognitive outcomes.
On the other hand, these data provide little or no evidence that the smartest women make the best mothers. Children can flourish in a wide variety of environments that are merely okay. But some environments are so bad that no one can seriously dispute that they are bad, and even the most resilient children have difficulty overcoming them. These truly disadvantaged homes are disproportionately associated with women at the low end of the intelligence distribution, even after other contributing factors such as poverty and socioeconomic status are taken into account.
Crime
Among the most firmly established facts about criminal offenders is that their distribution of IQ scores differs from that of the population at large. Taking the scientific literature as a whole, criminal offenders have average IQs of about 92, eight points below the mean. More serious or chronic offenders generally have lower scores than more casual offenders. The relationship of IQ to criminality is especially pronounced in the small fraction of the population, primarily young men, who constitute the chronic criminals that account for a disproportionate amount of crime. Offenders who have been caught do not score much lower, if at all, than those who are getting away with their crimes. Holding socioeconomic status constant does little to explain away the relationship between crime and cognitive ability.
High intelligence also provides some protection against lapsing into criminality for people who otherwise are at risk. Those who have grown up in turbulent homes, have parents who were themselves criminal, or who have exhibited the childhood traits that presage crime are less likely to become criminals as adults if they have high IQ.
These findings from an extensive research literature are supported by the evidence from white males in the . Low IQ was a risk factor for criminal behavior, whether criminality was measured by incarceration or by self-acknowledged crimes. The socioeconomic background of the NLSY’s white males was a negligible risk factor once their cognitive ability was taken into account.
C
rime can tear a free society apart, because free societies depend so crucially on faith that the other person will behave decently. As crime grows, society must substitute coercion for cooperation. The first casualty is not just freedom but the bonds that make community life attractive.
Yes, it is always possible to buy better locks, stay off the streets after dark, regard every stranger suspiciously, post security guards everywhere, but these are poor substitutes for living in a peaceful and safe neighborhood.
