The Big Sort (7 page)
Authors: Bill Bishop

We found that Republican counties tended to become more politically segregated than Democratic counties.
*
This happened in part because Republican migrants were unusually attracted to Republican communities. Between 1995 and 2000, 79 percent of the people who left Republican counties settled in counties that would vote Republican in 2004âand they were most likely to move to counties that would be Republican landslide counties. We don't know the politics of individual movers. We do know that when people left counties that would vote Republican in 2004, they were two and a half times more likely to move to other counties that would vote Republican than to those that would vote Democratic. By contrast, people who left counties that would vote Democratic in 2004 migrated to both Republican and Democratic counties without showing much of a preference for eitherâalthough they were unlikely to move to counties that would become Republican landslide counties.
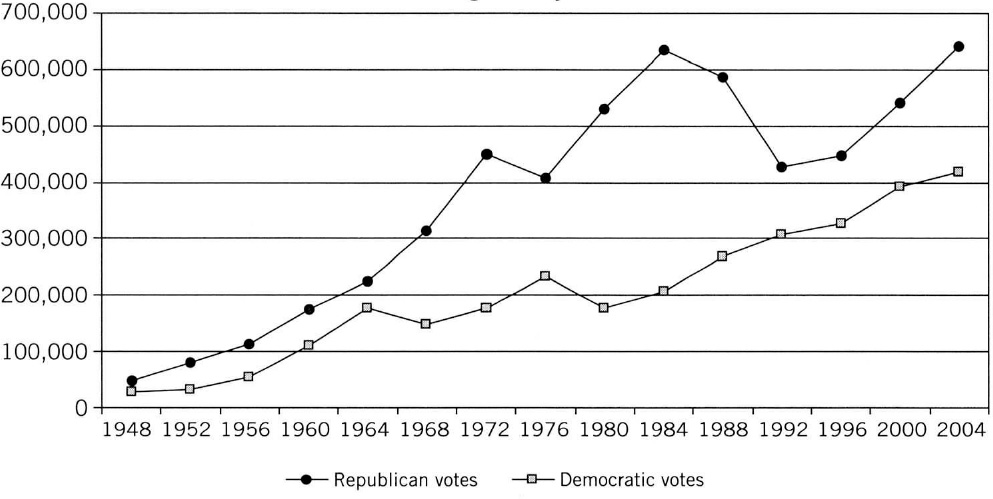
As a result of this sorting, most counties were zooming off in partisan directions. Between 1976 and 2004, the gap between the parties increased in 2,085 counties; only 1,026 counties (33 percent) grew more competitive. California is the stereotypical "blue" state. But within California, 17 counties grew more Democratic after 1976, and 30 became more reliably Republican. Only 11 California counties (19 percent) became more closely contested. In 1976, 44 percent of San Francisco County's population voted for Republican Gerald Ford. Over the next seven presidential elections, the percentage of San Franciscans voting for the Republican presidential candidate dropped every four years. By 2004, just 15 percent of San Francisco's voters supported George W. Bush. San Francisco didn't become more Democratic because its population grew; the number of voters in San Francisco County hadn't changed since 1948. San Francisco was transformed because Democrats sorted themselves in and Republicans sorted themselves out. Orange County was always Republican. But despite a population that nearly tripled (and in a state that grew increasingly Democratic), Orange County voted more Republican in 2004 than in 1964, when Barry Goldwater and the John Birch Society were going strong. Literally next door, Los Angeles followed a more mixed path until 1988 and then became increasingly more Democratic (see
Figure 2.1
).
*
This process of self-segregation would be inconsequential if only a few Americans lived in politically homogeneous counties. But the numbers, we learned, aren't small. In 2004, one-third of U.S. voters lived in counties that had remained unchanged in their presidential party preference since 1968. Just under half lived in counties that hadn't changed since 1980, 60 percent lived in counties that hadn't changed since 1988, and nearly 73 percent lived in counties that hadn't changed since 1992, voting consistently Democratic or Republican for four presidential elections in a row. National political choices were being carved into local geographies.
At the same time, we found that the number of counties with landslide majorities continued to increase. In the exceedingly close election of 1976 (Carter versus Ford), 38 percent of the nation's counties had a spread larger than 20 percentage points. In the exceedingly close election of 2004 (Bush versus Kerry), more than 60 percent of all U.S. counties produced landslide elections. As some 10 million Americans moved each year from one county to another, counties clearly were growing less competitive and more politically segregated.
Â
Figure 2.1 Distant Neighbors
Â
The politics of Los Angeles and Orange Counties
are diverging, as seen in presidential voting.
Â
Orange County
Â
Los Angeles County
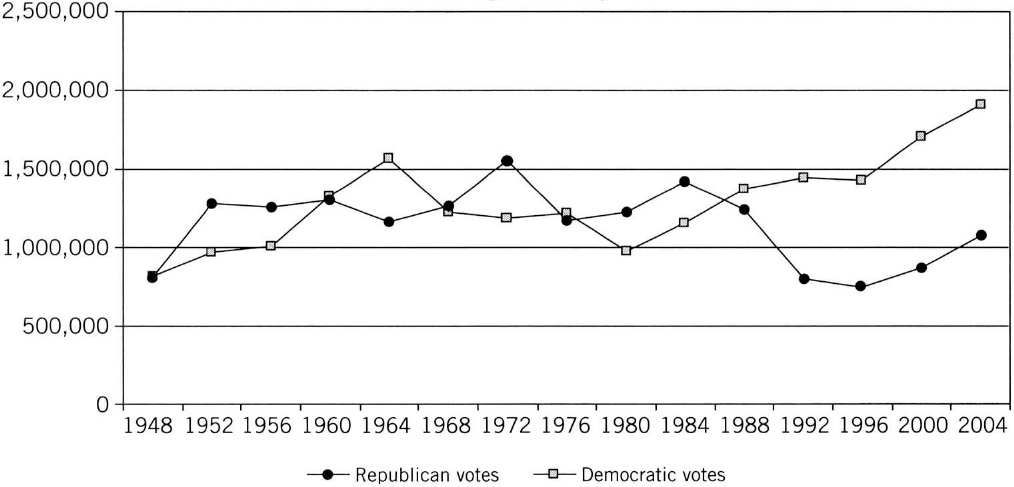
Source: Dave Leip's Atlas of U.S. Presidential Elections,
http://www.uselectionatlas.org.
The tipping phenomenon was fractalâit appeared no matter how large or how small the geography. Political commentators blame much of the nation's ideological polarization on the switch in the South from Democratic to Republican. Indeed, the South has become increasingly partisan since 1976 as it has become solidly Republican. But we found that
every
region in the country has become more segmented as it has tipped toward one party or the other. The U.S. Census Bureau divides the states into nine regions. All nine grew more segregated politically over the past six elections.
2
And the South is not the only region that has switched allegiance. The Pacific Coast, the Middle Atlantic States, and the North Central region were all Republican in 1948. Now these regions are strongly Democraticâand they are more politically lopsided than much of the South. Within the nine regions, there are also fewer competitive states. In the 1976 presidential contest between Carter and Ford, nineteen states had margins of 10 percentage points or more. By 2004, thirty-one states had at least a io-point margin. In 1976, the average presidential election margin in the states was 8.9 points. In 2004, it was a bleak 14.8 points.
3
Â
Test Two: Does Geography Matter?
Is it just my imagination, or is Lubbock, Texas, really a very different place politically and culturally from Cambridge, Massachusetts?
*
Of course. (Lubbock is the Republican town, in case you didn't know.) But generally, are there significant differences in the lifestyles and beliefs of people living in solidly Republican and solidly Democratic counties? To find out, we compiled polls conducted by the Pew Research Center from 1996 through 2004 and analyzed the results by how the counties voted in the 2004 election.
4
We compared strong Republican counties (where Bush won by 10 percentage points or more) with strong Democratic counties (where Kerry won by 10 points or more). We found the following:
- In strongly partisan Republican counties, 57 percent of the people were married. In strongly Democratic counties, 47 percent of the people were married.
- Only 21 percent of the people in Republican counties earned more than $75,000 a year. In Democratic counties, 29 percent earned that.
- Republican counties were 86 percent white. Democratic counties were 70 percent white.
- In Republican counties, 46 percent of the people said that they went to church at least once a week, and half described themselves as Evangelicals. In Democratic counties, only 34 percent of the people went to church at least once a week, and 32 percent were Evangelicals.
These figures are misleading, however. The standard way to calculate public opinion is to take a groupâEvangelicals, the rich, the youngâand then describe how this supposedly homogeneous group thinks or votes across the nation. People who go to church once a week or who describe themselves as Evangelicals are thought to be stand-up Republicans and early supporters of the war in Iraq. Nationally, that is absolutely true. But Evangelicals living in counties that voted heavily for Kerry in 2004 are an entirely different breed from those living in Republican landslide counties. According to our analysis of the Pew Research Center's polls, less than half of the weekly churchgoers and self-described Evangelicals in heavily Democratic counties supported the war in Iraq in 2004. In heavily Republican counties, however, this same demographic group supported the war three to one.
Regardless of demographic categoryâage, gender, religion, occupationâPew found a difference in support for the war based on geography. Labor union members were against the war in Democratic counties but for it in Republican counties. (Nearly 30 percentage points separated union members in strong Democratic counties versus strong Republican counties.) Women were against the war in Democratic counties but for it in Republican counties (a difference of 23 percentage points). The partisanship of place overpowered the categories that researchers normally use to describe durable voting blocks.
Scott Keeter at the Pew Research Center used findings from a large poll taken in 2004 to conduct his own test of the power of geography. His unpublished report runs 136 pages.
5
Each page tells the same story: the differences between partisan counties were wide and deep. For example, 48 percent of the people living in Democratic landslide counties felt "strongly" that homosexuality "is a way of life that should be
accepted
by society." Only 21 percent of the people in Republican landslide counties agreed. In Republican counties, 49 percent believed "strongly" that homosexuality should be "
discouraged
by society," compared to 27 percent in Democratic counties. These two Americas, separated by county lines, disagreed significantly on the war in Iraq, the USA Patriot Act, and the use of military force in carrying out foreign policy. In Republican strongholds, half the people had guns in their homes; in Democratic areas, only 19 percent did.
Â
Test Three: The 20/20 Hindsight Experiment
We began our "hindsight" experiment by dividing the nation's more than 3,100 counties into four groups based on the results of the 2004 election.
*
There were two groups of landslide countiesâplaces where either George W. Bush or John Kerry won by 20 percentage points or more. That left two other groups of counties, one Democratic and the other Republican, that were competitive in the 2004 electionâplaces where the vote totals for the two candidates differed by less than 20 percentage points. Each group contained a sizable proportion of the American population. The two groups of Democratic counties contained about 128 million people in 2000. The two groups of Republican counties were home to about 152 million people.
For this test, we examined these groups retrospectively, tracking them through time to see if and how their demographic composition changed. We knew where the groups of counties stood at the time of the highly polarized 2004 election. What we wanted to know was how they got there and whether the four groups had anything more in common than how they voted for president on the first Tuesday in November 2004.
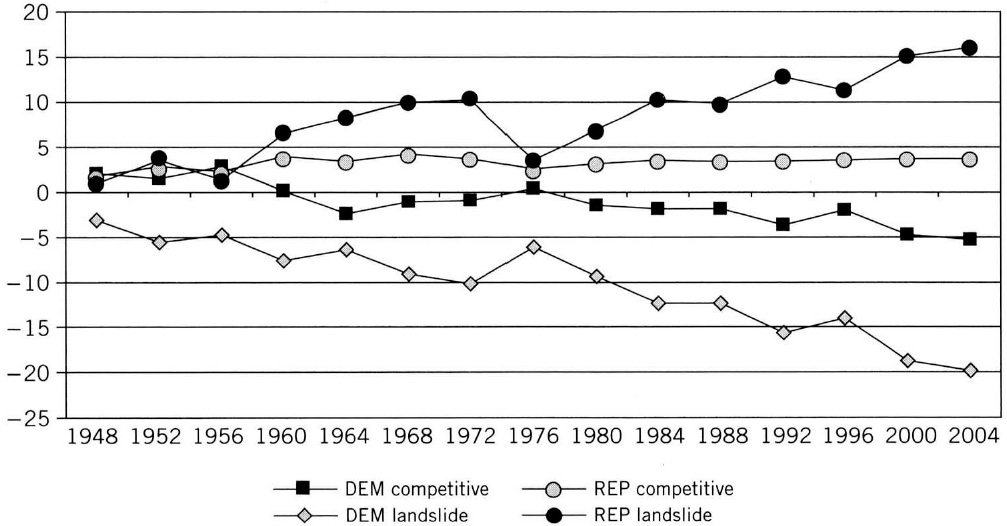
First, we looked to see if the groups had any political coherence. From 1948 to 1960, the four groups jumped about, voting for Democrats in some years, Republicans in others. In 1976, the groups all voted at about the national average (see
Figure 2.2
). Beginning in 1980 with the first election of Ronald Reagan, the counties began to diverge in their political inclinations, and they continued to separate for the next quarter century.
This pattern appeared again and again as we evaluated other demographic measures.
Education.
In 1970, the county groups were well balanced in the proportion of the population that had a college degree. After that, the percentage of college-educated people increased in every groupâbut the well-educated were especially attracted to Democratic counties (see
Figure 2.3
). People with college degrees increased the most in the Democratic landslide counties, where 29 percent of the adult population had at least a college degree in 2000. In the Republican landslide counties, 20 percent of those over twenty-five years of age had a bachelor's degree or higher in 2000. According to the 2000 census, in seventeen states (including the District of Columbia), the proportion of the population with an advanced degree was higher than the national average. In 2004, John Kerry won thirteen of those states, or 76.5 percent. In thirty-four states, the proportion of people with a postgraduate degree was lower than the national average. George Bush won twenty-seven of those states, or 79.4 percent.
Â
Figure 2.2 The Separation of American Communities
Â
Political divisions found in the 2004 election
have been growing for decades.
Â
Percent Vote for the Republican Presidential Candidate as a Deviation from the Mean Vote