The Big Sort (8 page)
Authors: Bill Bishop

Note:
Republican landslide counties:
George W. Bush won by 20 percentage points or more in the 2004 presidential election.
Democratic landslide counties:
John Kerry won by 20 percentage points or more.
Republican competitive counties:
Bush won by less than 20 percentage points.
Democratic competitive counties:
Kerry won by less than 20 percentage points. 0 (zero) represents the average Republican presidential vote for the entire United States. Dropping below the 0% line means the county group is voting more Democratic than the nation as a whole. Above means the county group is more Republican.
Source: Dave Leip's Atlas of U.S. Presidential Elections,
http://www.uselectionatlas.org.
Religion.
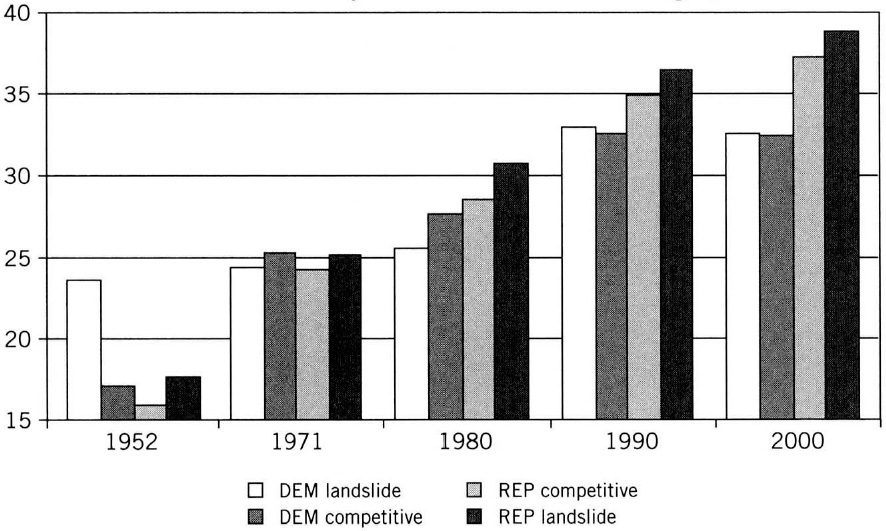
Church members seemed to be increasingly concentrated in Republican counties. The Glenmary Research Center collects data on the number of church members in regular surveys. According to this data, from 1971 to 2000, the number of church members increased 33.8 percent in Democratic landslide counties. In the same period, the number of church members jumped 54.4 percent in Republican landslide counties. From 1990 to 2000, Democratic counties lost churchgoers, while Republican counties continued gaining (see
Figure 2.4
). We even discovered a difference in migration patterns between counties with a high percentage of churchgoers and those that were more secular. Only 11 percent of the people who moved out of the counties with the most churchgoers moved to the most secular counties. The reverse was true, too: only 5 percent of those who left the most secular counties migrated to the counties with the highest percentage of churchgoers.
Â
Figure 2.3 Separation by Education
Â
Democratic landslide counties have been
gaining citizens with B.A. degrees.
Â
Percent of County Population with B.A. Degree or Higher (25 years of age)

Sources: Dave Leip's Atlas of U.S. Presidential Elections,
http://www.uselectionatlas.org
; U.S. Census of Population,
http://www.census.gov
.
Immigrants.
The percentage of the U.S. population that was foreign-born increased in every group of counties, but those born outside the United States favored Democratic counties. By 2000, 21 percent of the population in Democratic landslide counties was foreign-born, compared to just 5 percent in Republican landslide counties (see
Figure 2.5
).
Â
Figure 2.4 The Separation of Churchgoers
Â
Republican landslide counties have gained the
most church members in the past fifty years.
Â
Number of Church Members by 2004 Presidential Election Margin (in millions)
Sources: Dave Leip's Atlas of U.S. Presidential Elections,
http://www.uselectionatlas.org
; Glenmary Research Center, Religious Congregations & Membership in the United States,
http://glenmary.org/GRC/grc_shopping.htm
.
Race.
In 1970, each of the four county groups was home to about a quarter of the nation's white populationâthat is, whites were distributed evenly throughout the groups. (Republican landslide counties actually had a slightly
smaller
percentage of the total white population than did Democratic landslide counties.) Over the next thirty years, however, whites became more concentrated in Republican counties. Democratic countiesâespecially Democratic landslide countiesâlost shares of white population. By the time of the 2000 census, only 18 percent of the nation's white population lived in Democratic landslide counties. By contrast, in 2000, 30 percent of America's white population lived in counties that provided Republican landslide margins in the 2004 presidential election (see
Figure 2.6
). The real "white flight" of the past two generations has been whites moving to communities that were becoming staunchly Republican.
Â
Figure 2.5 The Immigration Divide
Â
Foreign-born citizens move to Democratic counties.
Â
Percent of County Population That Is Foreign-Born

Sources: Dave Leip's Atlas of U.S. Presidential Elections,
http://www.uselectionatlas.org
; U.S. Census of Population,
http://www.census.gov
.
Â
Figure 2.6 The New White Flight
Â
Whites have increasingly clustered in the counties
that voted Republican in 2004.
Â
Share of U.S. White Population

Sources: Dave Leip's Atlas of U.S. Presidential Elections,
http://www.uselectionatlas.org
; U.S. Census of Population,
http://www.census.gov
.
From 1980 to 2006, Republican counties gained about 50 million people, and Democratic counties gained about 22 million people (see
Figure 2.7
). That means that Republican counties grew by 1 million more people a year than Democratic counties. And projections from the U.S. Census Bureau show that this trend will continueâwill even accelerateâin the current century.
Birthrates are higher in Republican areas than in Democratic areas. This phenomenon has been described as the "liberal baby bust" by
USA Today.
In 2004,
New York Times
columnist David Brooks wrote that the higher birthrates in Republican areas were part of a "natalism" movement. "They are having three, four or more kids," Brooks wrote of America's "natalists." "Their personal identity is defined by parenthood. They are more spiritually, emotionally and physically invested in their homes than in any other sphere of life, having concluded that parenthood is the most enriching and elevating thing they can do. Very often they have sacrificed pleasures like sophisticated movies, restaurant dining and foreign travel, let alone competitive careers and disposable income, for the sake of their parental calling." Some observers of the trend Brooks described predicted that the baby advantage in Republican areas would lead inevitably to larger Republican majorities.
6
It's a plausible theory, but to this point, it isn't the primary reason red counties are gaining population faster than blue ones. People are born, it's true, but they also die. And it happens that death rates in Republican counties are also higher than in Democratic counties. When deaths are included in the calculation, it turns out that the natural increases in populationâbirths minus deathsâaccount for very little of the growing difference in population between Republican and Democratic counties. Republican counties gained about 28 million more people than Democratic counties between 1980 and 2006, but only 2.9 million of that increase was due to natural increases in population. (Immigrants aren't included in these calculations.)
Â
Figure 2.7 The Republican Population Shift
Â
The greatest population increases have taken place
in counties voting Republican in 2004.
Â
Total Population by County Type (in millions)

Sources: Dave Leip's Atlas of U.S. Presidential Elections,
http://www.uselectionatlas.org
; U.S. Census of Population, U.S. Census estimates,
http://www.census.gov
.
Instead, almost all of the Republican county population jackpot was because of domestic migration. In absolute numbers, Republican counties were the winners in the Big Sort. In fact, we found that the Republican counties with the strongest majorities were the most attractive to those who moved. Meanwhile, from 1990 to 2006 alone, 13 million people moved from Democratic to Republican counties.
Many more people moved to Republican landslide counties than to Democratic landslide counties, but they were considerably poorer, earning on average only three-quarters of the income of migrants to Democratic landslide counties. In 2003, the individual income of people moving from another state into a Democratic landslide county averaged $30,492, according to IRS figures. Those moving from another state to a Republican landslide county had an average income of $22,939. And the more Republican the county, the poorer the migrant. Those moving to competitive Republican counties earned on average $25,120, almost $2,200 more than migrants to landslide counties.
Migrants with the highest incomes were those moving from a Democratic landslide county in one state to a Democratic landslide county in another state. Their incomes were 37 percent higher than the national average. Migrants with the lowest incomes were those moving between Republican landslide counties within a state. They earned 30 percent less than the national average. There is simply no telling what the consequences will be of this kind of economic sorting.
Seen in light of the Big Sort, some puzzling dimensions of American politics begin to make sense. For example, traditionally Republican Colorado has become increasingly Democratic over the years. In 2004, Kerry cut Bush's margin of victory there to half of what it had been in 2000. A Democrat won the U.S. Senate seat in 2004, and the party swept both houses of the state legislature. Democrat Bill Ritter won the governor's race in 2006 based in large part on his promotion of alternative energy. Ronald Brownstein of the
Los Angeles Times,
writing in 2006, found that the language of politics in the state had shifted. People were more concerned with government services than with low taxes or abortion. "The whole rhetoric has changed in the past four or five years," a Democrat in Denver told Brownstein.
7