The End of Growth: Adapting to Our New Economic Reality (11 page)
Read The End of Growth: Adapting to Our New Economic Reality Online
Authors: Richard Heinberg
Tags: #BUS072000

A Marxist would say that all of this flows from the inherent imperatives of capitalism. A historian might contend it reflects the inevitable trajectory of all empires (though past empires didn’t have fossil fuels and therefore lacked the means to become global in extent). And a cultural anthropologist might point out that the causes of our debt spiral are endemic to civilization itself: as the gift economy shrank and trade grew, the infinitely various strands of mutual obligation that bind together every human community became translated into financial debt (and, as hunter-gatherers intuitively understood, debts within the community can never fully be repaid — nor should they be; and certainly not with interest).
In the end perhaps the modern world’s dilemma is as simple as “What goes up must come down.” But as we experience the events comprising ascent and decline close up and first-hand, matters don’t appear simple at all. We suffer from media bombardment; we’re soaked daily in unfiltered and unorganized data; we are blindingly, numbingly overwhelmed by the rapidity of change. But if we are to respond and adapt successfully to all this change, we must have a way of understanding why it is happening, where it might be headed, and what we can do to achieve an optimal outcome under the circumstances. If we are to get it right, we must see both the forest (the big, long-term trends) and the trees (the immediate challenges ahead).
Which brings us to a key question: If the financial economy cannot continue to grow by piling up more debt, then what will happen next?
BOX 1.3
The Magic of Compound Interest
Suppose you have $100. You decide to put it into a savings account that pays you 5 percent interest. After the first year, you have $105. You leave the entire amount in the bank, so at the end of the second year you are collecting 5 percent interest not on $100, but on $105 — which works out to $5.25. So now you have $110.25 in your account. At first this may not seem all that remarkable. But just wait. After three years you have $115.76, then $121.55, then $127.63, then $134.01. After ten years you would have $162.88, and at the end of fourteen years you would have nearly doubled your initial investment. After 29 years you would have about $400, and if you could manage to leave your investment untouched for forty-three years you would have nearly $800. After eighty-six years your heirs could collect $3,200, and after a full century had passed your initial $100 deposit would have grown to nearly $6,200. Of course, if this were a debt rather than an investment, interest would compound similarly.
Somehow these claims on real wealth (goods and services) have multiplied, while the world’s stores of natural resources have in many cases actually declined due to depletion of fossil fuels and minerals, or the over-harvesting of forests and fish. Money, if invested or loaned, has the “right” to increase, while nature enjoys no such imperative.

FIGURE 10.
Additive growth.
Here we see an additive growth rate of 5. Beginning with 100, we add 5, and then add 5 to that sum, and so on. After 50 transactions we arrive at 350.

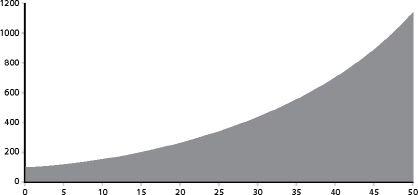
FIGURE 11.
Compounded growth.
This graph shows a compound growth rate of 5 percent, which means we start by multiplying 100 by 5 percent and then add the product to the original 100. Then we multiply that sum by 5 percent and add the product to the original sum, and so on. After 50 transactions, we arrive at 1147.
We’re in the midst of a once-in-a-lifetime set of economic conditions.
The perspective I would bring is not one of recession.
Rather, the economy is resetting to a lower level of business and
consumer spending based largely on the reduced leverage in the
economy.
— Steven Ballmer (Chairman, Microsoft Corp.)
If the previous chapter had been written as a novel, one wouldn’t have to read long before concluding that it is a story unlikely to end well. But it is not just a story, it is a description of the system in which our lives and the lives of everyone we care about are all embedded. How economic events unfold from here on is a matter of more than idle curiosity or academic interest.
It’s not hard to find plenty of opinions about where the economy is, or should be, headed. There are Chicago School economists, who see debt and meddling by government and central banks as problems and austerity as the solution; and Keynesians, who see the problem as being insufficient government stimulus to counter deflationary trends in the economy. There are those who say that bloated government borrowing and spending mean we are in for a currency-killing bout of hyperinflation, and those who say that government cannot inject enough new money into the economy to make up for commercial banks’ hesitancy to lend, so the necessary result will be years of deflationary depression. As we’ll see, each of these perspectives is probably correct up to a point. Our purpose in this chapter will not be to forecast exactly how the global economic system will behave in the near future — which is impossible in any case because there are too many variables at play — but to offer a brief but fairly comprehensive, non-partisan survey of the factors and forces at work in the post-2008 global financial economy, integrating various points of view as much as possible.
To do this, we will start with a brief overview of the meltdown that began in 2007, then look at the theoretical and practical limits to debt; we will then review the bailout and stimulus packages deployed to lessen the impact of the crisis; and finally we will explore a few scenarios for the short- and mid-term future.
This won’t hurt much. Honest.
Houses of Cards
Lakes of printer’s ink have been spilled in recounting the events leading up to the financial crisis that began in 2007–2008; here we will add only a small puddle. Nearly everyone agrees that it unfolded in essentially the following steps:
• In an attempt to limit the consequences of the “dot-com” crash of 2000, the Federal Reserve drastically lowered interest rates, enabling lenders across the country to provide
easy credit
to households and businesses who hadn’t been able to access it before.
• This led to a
housing bubble
, which was made much worse by
sub-prime
lending
.
• Partly because of the prior
deregulation
of the financial industry, the housing bubble was also magnified by
over-leveraging
within the financial services industry, which was in turn exacerbated by
financial
innovation and complexity
(including the use of derivatives, collateralized debt obligations, and a dizzying variety of related investment instruments) — all feeding the boom of a
shadow banking system
, whose potential problems were hidden by
incorrect pricing of risk
by ratings agencies.
• A
commodities boom
(which drove up gasoline and food prices) and temporarily
rising interest rates
(especially on adjustable-rate mortgages) ultimately undermined consumer spending and confidence, helping to burst the housing bubble — which, once it started to deflate, set in motion a chain reaction of defaults and bankruptcies.
Each element of that brief description has been unpacked at great length in books like Andrew Ross Sorkin’s
Too Big to Fail
and Bethany McLean’s and Joe Nocera’s
All the Devils Are Here
, and in the documentary film “Inside Job.”
1
It’s old, sad news now, though many parts of the story are still controversial (e.g., was the problem
deregulation
or
bad regulation
?). And yet, many analyses overlook the fact that these events were manifestations of a deeper trend toward dramatically and unsustainably increasing debt, credit, and leverage. So it’s important that we review this recent history in a little more detail so we can see why, from a purely financial point of view, growth is currently on hold and is unlikely to return for the foreseeable future.
Setting the Stage: 1970 to 2001
Starting in the 1970s, GDP growth rates in Western countries began to taper off. The US had been the world’s primary oil producer, but in 1971 its oil production peaked and began to decline. That meant US oil imports would have to increase to compensate, thus encouraging trade deficits. Moreover, domestic markets for major consumer goods were becoming saturated.
In the US, inflation-adjusted wages — particularly for the hourly workers who comprise 80 percent of the workforce — were stagnating after fifteen decades of major gains. Relatively constant wage levels meant that most households couldn’t afford to
increase
their spending (remember: the health of the economy requires
growth
) unless they saved less and borrowed more. Which they began to do.
With the rate of growth of the real economy stalling somewhat, profitable investment opportunities in manufacturing companies dwindled; this created a surplus of investment capital looking for high yields. The solution hit upon by wealthy investors was to direct this surplus toward financial markets.
The most important financial development during the 1970s was the growth of
securitization
— the financial practice of pooling various types of contractual debt (such as mortgages, auto loans, or credit card debt) and selling it to investors in the forms of bonds or collateralized mortgage obligations (CMOs). The principal and interest on the debts underlying the security were paid back to investors regularly, while the security itself could be sold and re-sold. Securitization provided an avenue for more investors to fund more debt. In effect, securitization allowed claims on wealth to increase far above previous levels. In the US, aggregate debt began rising faster than GDP, with the debt-to-GDP ratio growing from about 150 percent (where it had been for many years until 1980) up to its current level of about 300 percent.
In fact, US aggregate debt has increased
more than GDP for every year since 1965
.

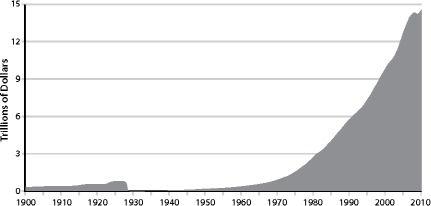
FIGURE 12.
US GDP, 1900–2010.
This chart shows nominal US Gross Domestic Product (GDP). GDP plummets in 1929 as a result of the stock market crash, then takes almost forty years to recover. We also see the rapid growth of US GDP beginning in 1975 and continuing until the financial crisis of 2008, where we observe a dip in the graph. Source: Years 1900–1928, Louis Johnston and Samuel H. Williamson, “What Was the US GDP Then?” MeasuringWorth, 2010. Years 1929–2010, US Bureau of Economic Analysis.
