The End of Growth: Adapting to Our New Economic Reality (13 page)
Read The End of Growth: Adapting to Our New Economic Reality Online
Authors: Richard Heinberg
Tags: #BUS072000


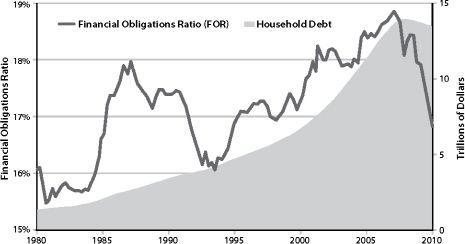
FIGURE 15.
US Household Debt.
Financial obligations ratio and total outstanding nominal debt of US households. A household’s financial obligations ratio (FOR) is the ratio of its financial obligations (mortgage, consumer debt, automobile lease payments, rental payments on tenant-occupied property, homeowner’s insurance, and property tax payments) to its disposable income. Just before the financial crisis, households were spending almost 19 percent of their disposable income on servicing their debt. Total outstanding household debt also peaked in 2008 just before the financial crisis at almost $14 trillion. To put this amount in perspective, the entire US economy was worth $14.3 trillion that same year. Source: The Federal Reserve.

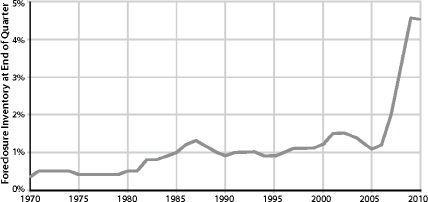
FIGURE 16.
US Foreclosure Rate, 1970–2010.
US foreclosure inventory at the end of each quarter. From 1970–2001, yearly averages are shown; from 2002–2010 quarterly data is shown. The foreclosure rate jumped dramatically during the financial crisis from 1.28 percent at the start of 2007 to 4.63 percent at the start of 2010, the highest level in the last forty years. Source: Mortgage Bankers Association, National Delinquency Survey, Foreclosure Inventory at End of Quarter.
Once property prices began to plummet and the subprime industry went bust, dominos throughout the financial world began toppling.
On September 15th, 2008, the entire financial system came within 48 hours of collapse. The giant investment house of Lehman Brothers went bankrupt, sending shock waves through global financial markets.
6
The global credit system froze, and the US government stepped in with an extraordinary set of bailout packages for the largest Wall Street banks and insurance companies. All told, the US package of loans and guarantees added up to an astounding $12 trillion. GDP growth for the nation as a whole went negative and eight million jobs disappeared in a matter of months.
7
Much of the rest of the world was infected, too, due to interlocking investments based on mortgages. The Eurozone countries and the UK experienced economic contraction or dramatic slowing of growth; some developing countries that had been seeing rapid growth saw significant slowdowns (for example, Cambodia went from ten percent growth in 2007 to nearly zero in 2009); and by March 2009, the Arab world had lost an estimated $3 trillion due to the crisis — partly from a crash in oil prices.
Then in 2010, Greece faced a government debt crisis that threatened the economic integrity of the European Union. Successive Greek governments had run up large deficits to finance public sector jobs, pensions, and other social benefits; in early 2010, it was discovered that the nation’s government had paid Goldman Sachs and other banks hundreds of millions of dollars in fees since 2001 to arrange transactions that hid the actual level of borrowing. Between January 2009 and May 2010, official government deficit estimates more than doubled, from 6 percent to 13.6 percent of GDP — the latter figure being one of the highest in the world. The direct effect of a Greek default would have been small for the other European economies, as Greece represents only 2.5 percent of the overall Eurozone economy — but it could have caused investors to lose faith in other European countries that also have high debt and deficit issues: Ireland, with a government deficit of 14.3 percent of GDP, the UK with 12.6 percent, Spain with 11.2 percent, and Portugal with 9.4 percent, were most at risk. And so Greece was bailed out with loans from the EU and the IMF, whose terms included the requirement to slash social spending.
By late November of 2010, it was clear that Ireland needed a bailout, too — and it got one, along with its own painful austerity package and loads of political upheaval. But this raised the inevitable questions: Who would be next? Could the IMF and the EU afford to bail out Spain if necessary? What would happen if the enormous UK economy needed rescue?
Meanwhile China — whose economy continued growing at a scorching 10 percent per year, and which had run a large trade surplus for the past three decades — had inflated its own enormous real estate bubble. Average housing prices in the country tripled from 2005 to 2009; and price-to-income and price-to-rent ratios for property, as well as the number of unoccupied residential and commercial units, were all sky-high.
In short, a global economy that had appeared robust and stable in 2007 was suddenly revealed to be very fragile, suffering from several persistent maladies — any one of which could erupt into virulence, spreading rapidly and sending the world back into the throes of crisis.

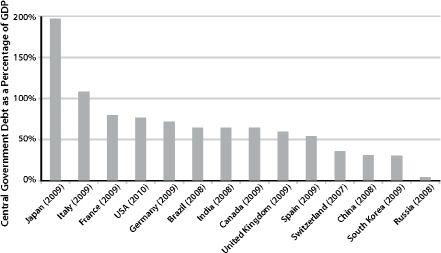
FIGURE 17A.
Central Government Debt as a Percentage of GDP for Various Countries.
High levels of government debt burden countries around the world, not just the US. For example, the debt of the Japanese government amounts to almost 200% of its GDP. Sources: McKin–sey Global Institute, “Debt and deleveraging: The global credit bubble and its economic consequences,” January 2010; The Federal Reserve.

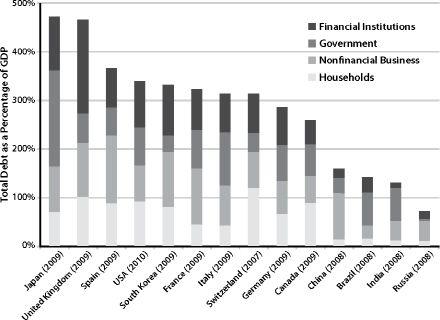
FIGURE 17B.
Total Debt by Sector as a Percentage of GDP for Various Countries.
Again we can see that the US is not alone when it comes to high levels of debt. The total debt of Japan and the UK amounts to around 450 percent of their respective GDP. Sources: McKinsey Global Institute, “Debt and deleveraging: The global credit bubble and its economic consequences,” January 2010; The Federal Reserve.
BOX 2.1
Plenty of Blame to Go Around
The bipartisan Financial Crisis Inquiry Commission (established by Congress as part of the Fraud Enforcement and Recovery Act of 2009) released its report in January 2011. The many causal factors it highlighted include:
• Federal Reserve Chairman (1987–2006) Alan Greenspan’s refusal to perform his regulatory duties because he did not believe in them. Green–span allowed the credit bubble to expand, driving housing prices to dangerously unsustainable levels while advocating financial deregulation. The Commission called this a “pivotal failure to stem the flow of toxic mortgages” and “the prime example” of government negligence.
• Federal Reserve Chairman (2006-present) Ben Bernanke’s failure to foresee the crisis.
• The Bush administration’s “inconsistent response” in saving one financial giant — Bear Stearns — while allowing another — Lehman Brothers — to fail; this “added to the uncertainty and panic in the financial markets.”
• Bush Treasury Secretary Henry Paulson Jr.’s failure to understand the magnitude of the problem with subprime mortgages.
• The Clinton White House’s (and Treasury Secretary Lawrence Summers’s) crucial error in shielding over-the-counter derivatives from regulation in the Commodity Futures Modernization Act; this constituted “a key turning point in the march toward the financial crisis.”
• Then NY Fed President, now Treasury Secretary Timothy F. Geithner’s failure to “clamp down on excesses by Citigroup in the lead-up to the crisis.”
• The Fed’s maintenance of low interest rates long after the 2001 recession, which “created increased risks.”
• The financial sector’s spending of $2.7 billion on lobbying from 1999 to 2008, with members of Congress affiliated with the industry raking in more than $1 billion in campaign contributions.
• The credit-rating agencies’ stamping of “their seal of approval” on securities that proved to be far more risky than advertised (because they were backed by mortgages provided to borrowers who were unable to make payments on their loans).
• The Securities and Exchange Commission’s permitting of the five biggest banks to ramp up their leverage, hold insufficient capital, and engage in risky practices.
• The nation’s five largest investment banks’ buildup of wildly excessive leverage: They kept only $1 in capital to cover losses for about every $40 in assets.
• The Office of the Comptroller of the Currency’s (along with the Office of Thrift Supervision’s) blocking of state regulators from reining in lending abuses.
• “Questionable practices by mortgage lenders and careless betting by banks.”
• The “bumbling incompetence among corporate chieftains” as to the risk and operations of their own firms. Among corporate heads at the large financial firms (including Citigroup, AIG, and Merrill Lynch), the panel says its examination found “stunning instances of governance breakdowns and irresponsibility.”
Commission members disagreed on the significance of the roles of Freddie Mac and Fannie Mae in the crisis.
The Commission has indicated that it will make criminal referrals.
8
The Mother of All Manias
The US real estate bubble of the early 2000s was the largest in history (in terms of the amount of capital involved).
9
And its crash carried an eerie echo of the 1930s: some economists have argued that it wasn’t just the stock market crash that drove the Great Depression, but also cascading farm failures, which made it impossible for farmers to make mortgage payments — along with housing bubbles in Florida, New York, and Chicago.
10
Real estate bubbles are essentially credit bubbles, because property owners generally use borrowed money to purchase property (this is in contrast to currency bubbles, in which nations inflate their currency to pay off government debt). The amount of outstanding debt soars as buyers flood the market, bidding property prices up to unrealistic levels and taking out loans they cannot repay. Too many houses and offices are built, and materials and labor are wasted in building them. Real estate bubbles also lead to an excess of homebuilders, who must retrain and retool when the bubble bursts. These kinds of bubbles lead to systemic crises affecting the economic integrity of nations.
11
